Data Vizzes

Data Vizzes

Turning Data Into Insights

  • Home
  • Tableau Tutorial
    • Tableau Basics
    • Tableau Charts
    • Tableau Calculations
    • Tableau Tips
    • Tableau Advanced Charts
    • Video Tutorials
    • Statistics
  • Daily Market Summary
  • Open Data Journalism
  • My Portfolio
  • Interactive Me

Month: April 2018

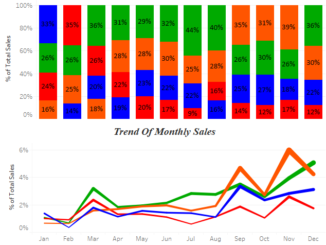
Tableau Tips: Sorting Stacked Bars

April 26, 2018 Rahul 1

Hello Folks, In this blog I will show you how to sort stacked bar charts. Sorting of stacked bars charts enable us to see the […]

When , Where, What & How of NYPD-Motor-Vehicle-Collisions: June14-Mar18

April 2, 2018 Rahul 0

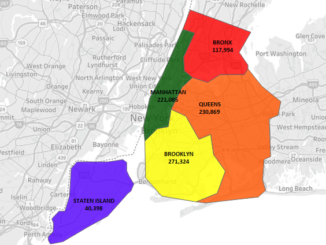
New York City encompasses five different county-level administrative divisions called boroughs: Manhattan, the Bronx, Queens, Brooklyn, and Staten Island. These are among the one of […]

Subscribe to our Daily Newsletter

Check your inbox or spam folder to confirm your subscription.

April 2018
S M T W T F S
1234567
891011121314
15161718192021
22232425262728
2930  
« Mar   May »
VizzingData

Simplifying market intelligence with data-driven insights and daily market radar reports.

Copyright © 2026 | WordPress Theme by MH Themes

error

Enjoy this blog? Please spread the word :)

  • YouTube
    YouTube
  • LinkedIn
    LinkedIn
    Share
  • Twitter
    Visit Us
    Follow Me
    Post on X
  • RSS