Data Vizzes

Data Vizzes

Turning Data Into Insights

  • Home
  • Tableau Tutorial
    • Tableau Basics
    • Tableau Charts
    • Tableau Calculations
    • Tableau Tips
    • Tableau Advanced Charts
    • Video Tutorials
    • Statistics
  • Daily Market Summary
  • Open Data Journalism
  • My Portfolio
  • Interactive Me

Month: September 2018

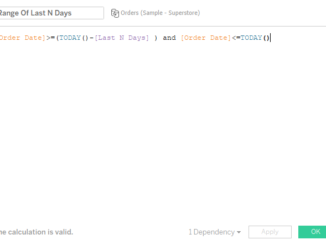
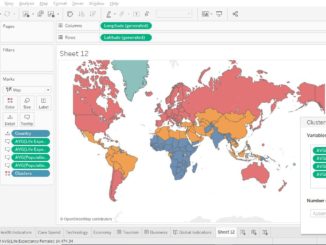
Analytics Pane: Uncover the inherent patterns in your data by clustering using Tableau

September 12, 2018 Rahul 0

Clustering is grouping similar observations or data points of similar measures. Clustering helps our daily businesses in many ways. Let’s see an example, there are […]

Tableau Dashboard Tips: Do’s and don’ts for designing efficient Tableau dashboard

September 12, 2018 Rahul 0

Dashboard to its user is what an assistant is his boss. While an assistant helps in managing multiple tasks for his boss, dashboard helps in […]

Tableau Dashboard Tips: Auto update filters when the data refreshed daily

September 12, 2018 Rahul 0

Hi All, This post is the first in the series where I will be discussing with tips and trick to enhance your tableau dashboard and […]

Subscribe to our Daily Newsletter

Check your inbox or spam folder to confirm your subscription.

September 2018
S M T W T F S
 1
2345678
9101112131415
16171819202122
23242526272829
30  
« Jun   Oct »
VizzingData

Simplifying market intelligence with data-driven insights and daily market radar reports.

Copyright © 2026 | WordPress Theme by MH Themes

error

Enjoy this blog? Please spread the word :)

  • YouTube
    YouTube
  • LinkedIn
    LinkedIn
    Share
  • Twitter
    Visit Us
    Follow Me
    Post on X
  • RSS