Data Vizzes

Data Vizzes

Turning Data Into Insights

  • Home
  • Tableau Tutorial
    • Tableau Basics
    • Tableau Charts
    • Tableau Calculations
    • Tableau Tips
    • Tableau Advanced Charts
    • Video Tutorials
    • Statistics
  • Daily Market Summary
  • Open Data Journalism
  • My Portfolio
  • Interactive Me

Day: January 12, 2020

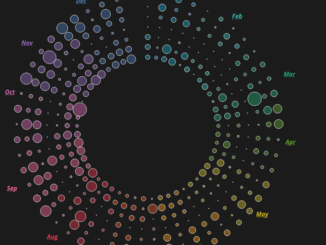
Circular Calendar Charts in Tableau

January 12, 2020 Rahul 0

Hoping that you guys enjoyed the previous blogs regarding Visualizing Time series and Circles with common base. Continuing to our posts on Circles , here […]

Subscribe to our Daily Newsletter

Check your inbox or spam folder to confirm your subscription.

January 2020
S M T W T F S
 1234
567891011
12131415161718
19202122232425
262728293031  
« Oct   Feb »
VizzingData

Simplifying market intelligence with data-driven insights and daily market radar reports.

Copyright © 2026 | WordPress Theme by MH Themes

error

Enjoy this blog? Please spread the word :)

  • YouTube
    YouTube
  • LinkedIn
    LinkedIn
    Share
  • Twitter
    Visit Us
    Follow Me
    Post on X
  • RSS