Data Vizzes

Data Vizzes

Turning Data Into Insights

  • Home
  • Tableau Tutorial
    • Tableau Basics
    • Tableau Charts
    • Tableau Calculations
    • Tableau Tips
    • Tableau Advanced Charts
    • Video Tutorials
    • Statistics
  • Daily Market Summary
  • Open Data Journalism
  • My Portfolio
  • Interactive Me

Month: May 2020

Vizzing Data Connect Episode 1

May 17, 2020 Rahul 0

In this first connect we discussed what are parameter actions and how to use them to make our dashboard more interactive.

Tableau Tip : Show/Hide Containers

May 12, 2020 Rahul 0

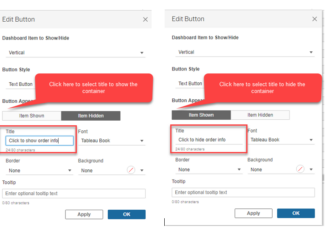
In this blog we are going to discuss how to create a collapsible container. From version 2019.2 , tableau had added a new feature in […]

Difference Between Sets and Groups

May 10, 2020 Rahul 0

This video explains the basic difference between sets and groups and where to use them depending on the scenario.

Introduction to Set Actions

May 10, 2020 Rahul 0

In this video we will go through the feature of set action in Tableau and see how to use them in our dashbaords.

Introduction to Parameter Actions

May 10, 2020 Rahul 0

This video gives an introduction to the feature of parameter actions in Tableau and how to use them in your dashboard to make them more […]

Subscribe to our Daily Newsletter

Check your inbox or spam folder to confirm your subscription.

May 2020
S M T W T F S
 12
3456789
10111213141516
17181920212223
24252627282930
31  
« Apr   Jun »
VizzingData

Simplifying market intelligence with data-driven insights and daily market radar reports.

Copyright © 2026 | WordPress Theme by MH Themes

error

Enjoy this blog? Please spread the word :)

  • YouTube
    YouTube
  • LinkedIn
    LinkedIn
    Share
  • Twitter
    Visit Us
    Follow Me
    Post on X
  • RSS