

VizzingData

VizzingData

From reactive reporting to proactive intelligence

  • Home
  • Services
  • The Augmented Analyst
  • Projects
  • Tableau Tutorial
    • Tableau Basics
    • Tableau Charts
    • Tableau Calculations
    • Tableau Tips
    • Tableau Advanced Charts
    • Video Tutorials
    • Statistics
  • About me
  • Contact

Tableau Tutorial

No Image

Tableau Tips: Selecting Top 3 Within Categories

July 5, 2017 Rahul 1

Hi All, In this blog I would show you how to get the top three sub categories under each Category. For this we would use […]
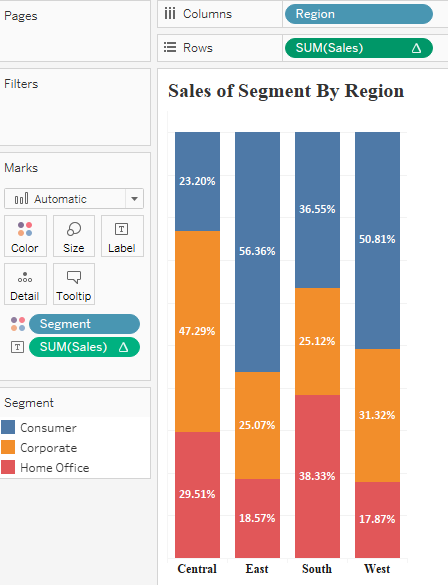
Tableau Charts : Bar Charts & Variants

July 5, 2017 Rahul 0

Hello Everyone out there. This is the first in series of  my blog post “Visualising data in Tableau from Scratch”. In the subsequent blog following this […]
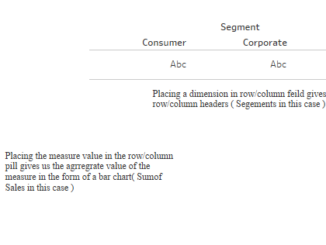
Tableau Basics : Measures And Dimensions

July 4, 2017 Rahul 2

The article guides us through the most basic concept in Tableau – Measures Dimensions and how to differentiate between the two. Whenever we import/connect a […]

Posts pagination

« 1 … 8 9

Sidebar

Please navigate to Appearance → Widgets in your WordPress dashboard and add some widgets into the Sidebar widget area.
VizzingData

An independent data and AI consultancy — analytics engineering, and Claude/AI applications that run in production.

Privacy Policy

Copyright © 2026 | WordPress Theme by MH Themes

error

Enjoy this blog? Please spread the word :)

  • YouTube
    YouTube
  • LinkedIn
    LinkedIn
    Share
  • Twitter
    Visit Us
    Follow Me
    Post on X
  • RSS