Data Vizzes

Data Vizzes

Turning Data Into Insights

  • Home
  • Tableau Tutorial
    • Tableau Basics
    • Tableau Charts
    • Tableau Calculations
    • Tableau Tips
    • Tableau Advanced Charts
    • Video Tutorials
    • Statistics
  • Daily Market Summary
  • Open Data Journalism
  • My Portfolio
  • Interactive Me

Radial Charts

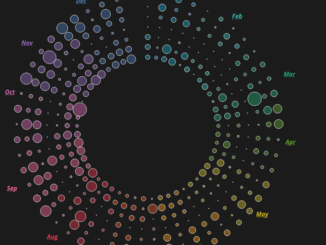
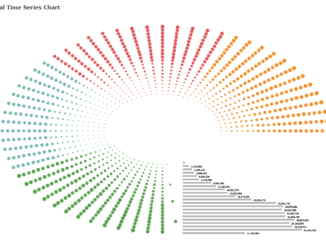
Circular Calendar Charts in Tableau

January 12, 2020 Rahul 0

Hoping that you guys enjoyed the previous blogs regarding Visualizing Time series and Circles with common base. Continuing to our posts on Circles , here […]

Visualizing Radial Time Series Data To Uncover Patterns in Tableau

January 5, 2020 Rahul 2

First of all A Happy New Year and decade to all those who are reading this. Last year was quite  a busy one and I […]

Subscribe to our Daily Newsletter

Check your inbox or spam folder to confirm your subscription.

May 2026
S M T W T F S
 12
3456789
10111213141516
17181920212223
24252627282930
31  
« Apr    
VizzingData

Simplifying market intelligence with data-driven insights and daily market radar reports.

Copyright © 2026 | WordPress Theme by MH Themes

error

Enjoy this blog? Please spread the word :)

  • YouTube
    YouTube
  • LinkedIn
    LinkedIn
    Share
  • Twitter
    Visit Us
    Follow Me
    Post on X
  • RSS