Data Vizzes

Data Vizzes

Turning Data Into Insights

  • Home
  • Tableau Tutorial
    • Tableau Basics
    • Tableau Charts
    • Tableau Calculations
    • Tableau Tips
    • Tableau Advanced Charts
    • Video Tutorials
    • Statistics
  • Daily Market Summary
  • Open Data Journalism
  • My Portfolio
  • Interactive Me

Tableau Advanced Charts

Advance Charting : Pareto Charts

July 9, 2017 Rahul 0

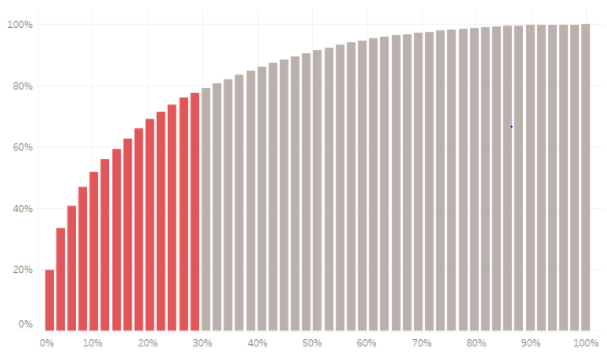
Hi All, In this blog I will be writing about how to build pareto charts in Tableau. A Pareto chart, also called a Pareto distribution […]

Advance Charting : Sankey Diagrams

July 9, 2017 Rahul 1

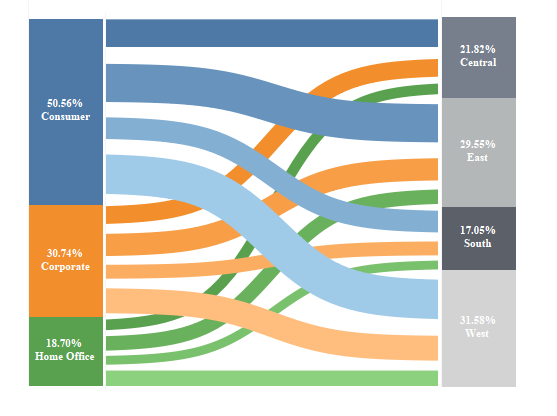
Hi All, In this blog post I will guide you through how to create a Sankey Diagram. Sankey diagrams are a specific type of flow diagram, […]

Posts pagination

« 1 2

Subscribe to our Daily Newsletter

Check your inbox or spam folder to confirm your subscription.

April 2026
S M T W T F S
 1234
567891011
12131415161718
19202122232425
2627282930  
« Mar    
VizzingData

Simplifying market intelligence with data-driven insights and daily market radar reports.

Copyright © 2026 | WordPress Theme by MH Themes

error

Enjoy this blog? Please spread the word :)

  • YouTube
    YouTube
  • LinkedIn
    LinkedIn
    Share
  • Twitter
    Visit Us
    Follow Me
    Post on X
  • RSS