Data Vizzes

Data Vizzes

Turning Data Into Insights

  • Home
  • Tableau Tutorial
    • Tableau Basics
    • Tableau Charts
    • Tableau Calculations
    • Tableau Tips
    • Tableau Advanced Charts
    • Video Tutorials
    • Statistics
  • Daily Market Summary
  • Open Data Journalism
  • My Portfolio
  • Interactive Me

Uncategorized

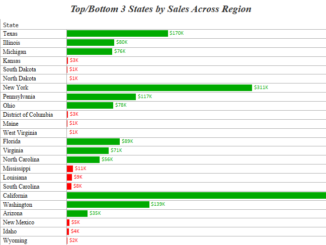
Tableau Tips : Displaying Top And Bottom in the same worksheet

September 3, 2017 Rahul 1

Hi All, Today I am going to discuss about the Top/Bottom Option that tableau provides us with to filter the dimension. Whenever we try to […]

Tableau Tips : Area Chart With Two Colours

September 1, 2017 Rahul 2

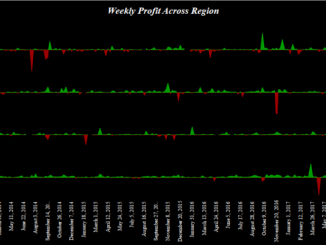
Hi Everybody out there. In todays tip I will show you an effective way of creating an area chart with two colours . Lets go […]

Subscribe to our Daily Newsletter

Check your inbox or spam folder to confirm your subscription.

April 2026
S M T W T F S
 1234
567891011
12131415161718
19202122232425
2627282930  
« Mar    
VizzingData

Simplifying market intelligence with data-driven insights and daily market radar reports.

Copyright © 2026 | WordPress Theme by MH Themes

error

Enjoy this blog? Please spread the word :)

  • YouTube
    YouTube
  • LinkedIn
    LinkedIn
    Share
  • Twitter
    Visit Us
    Follow Me
    Post on X
  • RSS