Data Vizzes

Data Vizzes

Turning Data Into Insights

  • Home
  • Tableau Tutorial
    • Tableau Basics
    • Tableau Charts
    • Tableau Calculations
    • Tableau Tips
    • Tableau Advanced Charts
    • Video Tutorials
    • Statistics
  • Daily Market Summary
  • Open Data Journalism
  • My Portfolio
  • Interactive Me

Day: August 5, 2017

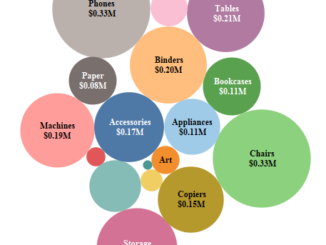
Tableau Charts : Packed Bubbles

August 5, 2017 Rahul 0

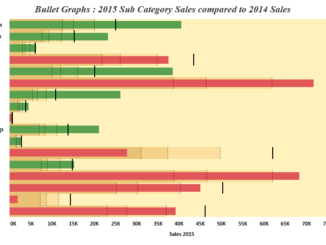
In the previous blog we discussed about Bullet Graphs. In this blog under the series Tableau Charts we will talk about Packed Bubbles . Packed […]

Tableau Charts : Bullet Graphs

August 5, 2017 Rahul 0

Hi everyone out there . Hope you guys are learning from the posts and are having a hands on practice in tableau side by side. […]

Tableau Charts : Box And Whisker Plots

August 5, 2017 Rahul 1

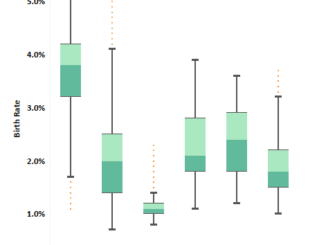
In the previous article we discussed about how to build and interpret a Histogram in Tableau . Today we will be discussing about how to build up […]

Subscribe to our Daily Newsletter

Check your inbox or spam folder to confirm your subscription.

August 2017
S M T W T F S
 12345
6789101112
13141516171819
20212223242526
2728293031  
« Jul   Sep »
VizzingData

Simplifying market intelligence with data-driven insights and daily market radar reports.

Copyright © 2026 | WordPress Theme by MH Themes

error

Enjoy this blog? Please spread the word :)

  • YouTube
    YouTube
  • LinkedIn
    LinkedIn
    Share
  • Twitter
    Visit Us
    Follow Me
    Post on X
  • RSS