Data Vizzes

Data Vizzes

Turning Data Into Insights

  • Home
  • Tableau Tutorial
    • Tableau Basics
    • Tableau Charts
    • Tableau Calculations
    • Tableau Tips
    • Tableau Advanced Charts
    • Video Tutorials
    • Statistics
  • Daily Market Summary
  • Open Data Journalism
  • My Portfolio
  • Interactive Me

Day: September 25, 2017

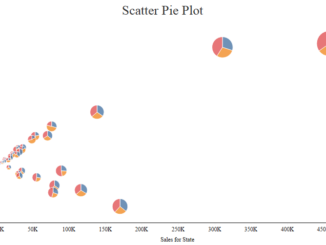
Advanced Charting : Scatter Pie Chart in Tableau

September 25, 2017 Rahul 0

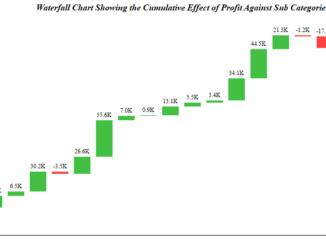
The previous article in the series highlighted the steps to create a waterfall chart in Tableau. Today we will discuss about a interesting chart in […]

Advanced Charting : Waterfall Charts in Tableau

September 25, 2017 Rahul 0

In the last article under Advanced Charting we discussed how to create Rank Charts in Tableau . Today we will discuss about how to make […]

Subscribe to our Daily Newsletter

Check your inbox or spam folder to confirm your subscription.

September 2017
S M T W T F S
 12
3456789
10111213141516
17181920212223
24252627282930
« Aug   Oct »
VizzingData

Simplifying market intelligence with data-driven insights and daily market radar reports.

Copyright © 2026 | WordPress Theme by MH Themes

error

Enjoy this blog? Please spread the word :)

  • YouTube
    YouTube
  • LinkedIn
    LinkedIn
    Share
  • Twitter
    Visit Us
    Follow Me
    Post on X
  • RSS