Data Vizzes

Data Vizzes

Turning Data Into Insights

  • Home
  • Tableau Tutorial
    • Tableau Basics
    • Tableau Charts
    • Tableau Calculations
    • Tableau Tips
    • Tableau Advanced Charts
    • Video Tutorials
    • Statistics
  • Daily Market Summary
  • Open Data Journalism
  • My Portfolio
  • Interactive Me

Day: July 18, 2017

Salaries Under Obama And Trump

July 18, 2017 Rahul 0

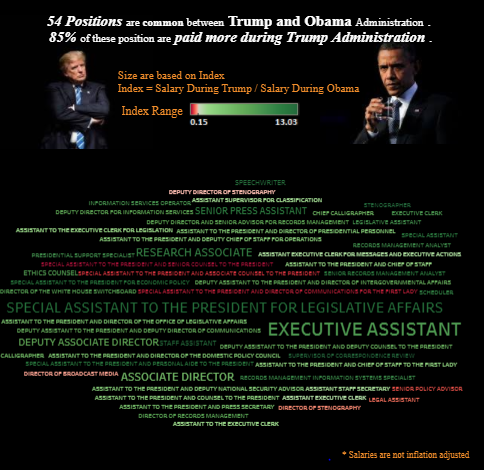
In this blog I tried to visualise how salaries were being paid across different positions under Obama and Trump. The total number of positions under […]

Advanced Charting : Diverging bar / Funnel Charts

July 18, 2017 Rahul 0

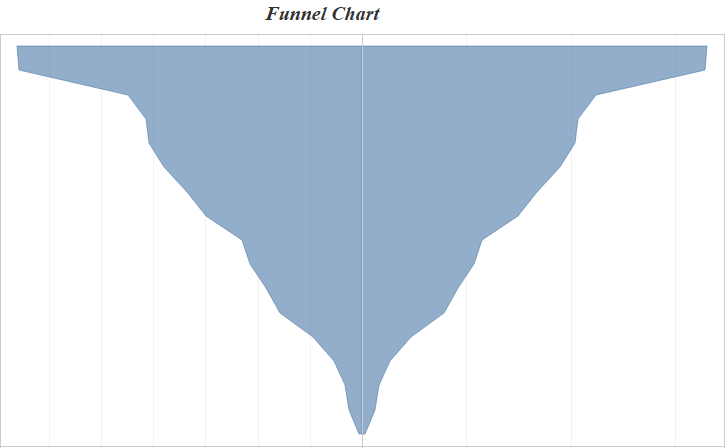
Hi All, In this blog of Advanced Charting using tableau we will see how to build a funnel chart / diverging bar chart in tableau. […]

Tableau Charts : Heat Maps & Highlight Tables

July 18, 2017 Rahul 1

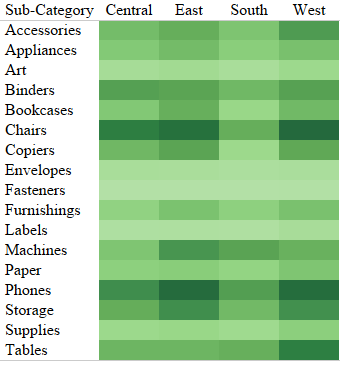
Hi All, In the previous blog in the series Tableau Charts we talked about Text Tables . Today we are going to talk about an extension of […]

Subscribe to our Daily Newsletter

Check your inbox or spam folder to confirm your subscription.

July 2017
S M T W T F S
 1
2345678
9101112131415
16171819202122
23242526272829
3031  
    Aug »
VizzingData

Simplifying market intelligence with data-driven insights and daily market radar reports.

Copyright © 2026 | WordPress Theme by MH Themes

error

Enjoy this blog? Please spread the word :)

  • YouTube
    YouTube
  • LinkedIn
    LinkedIn
    Share
  • Twitter
    Visit Us
    Follow Me
    Post on X
  • RSS