
Hi All,
In this blog of Advanced Charting using tableau we will see how to build a funnel chart / diverging bar chart in tableau. This is how a diverging bar chart and funnel chart looks like :
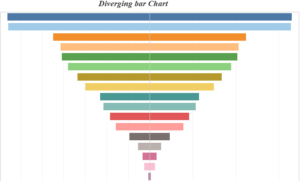
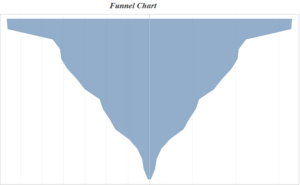
The step for creating these charts are the same . In a diverging bar chart the chart type selected is bar while in the funnel chart it us area.
Lets go ahead and create these charts.
Bring Sub Category to the rows , and sales to columns. Sort the view in descending order of Sales. Add the measures sales to the column again. Double click on the sales measure which is first in the columns and add a negative sign in front of it. Add Sub categories to the color and your divergent bar chart is ready.
Switch the chart from bar to area and you will get the funnel chart.
Hope you guys enjoyed the post. Do mention in the comments if you are not able to follow and keep visiting this area for interesting vizzes.
Thanks
Rahul Singh