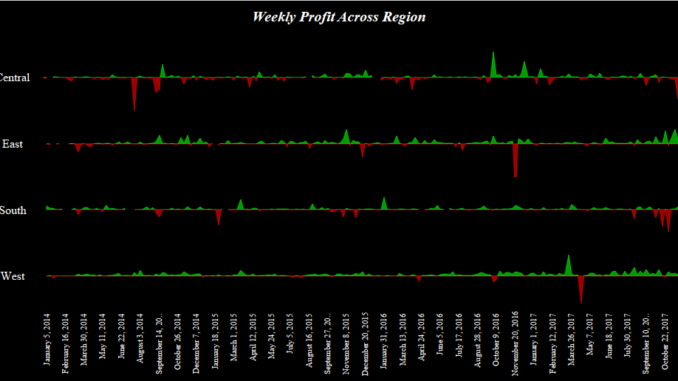
Hi Everybody out there. In todays tip I will show you an effective way of creating an area chart with two colours . Lets go ahead to create an area chart and try to understand what we are trying to achieve.
To create a area chart using the Superstore data , Drag Order Date to columns and from the dropdown select on weeks. Drag Profit to rows twice. This is what you would get :

Select the first Profit measure and go to edit axis for this . Select fixed and in the Fixed Start enter the value 0.

Select the second profit measure and go to edit axis. Select the fixed option and in the fixed end enter the value 0.

You screen should now look somewhat like this:

Select the color for the first value of measure in the rows to be green and the second value to be red. Unselect show header for both the measure in the row axis and your dual area chart is ready.

Let me know if you are not able to follow the steps.

How can i apply the color in final step.
Hi Madhu first of all thanks for your time.
Answering to your question, to apply the colors select the individual measures from the row pane ( where you have two pills of profit side by side ) and change the colors of them individually from the colors mark.