Hi All,
In this blog of the ongoing series on Tableau Charts we will talk about Treemaps. A treemap is a diagram representing hierarchical data in the form of nested rectangles, the area of each corresponding to its numerical value. These are ideal for displaying large amount of hierarchical data.
To create a treemap in Tableau we use one or more dimension and a maximum of 2 measures.
Lets go ahead and create a treemap in Tableau and see how do we interpret it. Lets say we would like to see the sales of Sub-categories across different regions .
Press Ctrl and select Subcategory and Sales from the sidebar.
In the show me tab select on Treemaps. As soon as you click on TreeMaps , it gets populated for you.
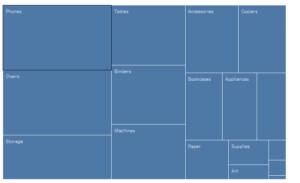
This is how your screen should look like now:

We see that we have the sales of the subcategories in the form of a grid with the size of the grid proportional to its sales. At the first look we can say that the maximum sales was for the subcategory Phones. We however do not get idea of the Category that is selling the most until we know from beforehand under which Category the sub category fall.To achieve this we can add another dimension Category into the colours mark.
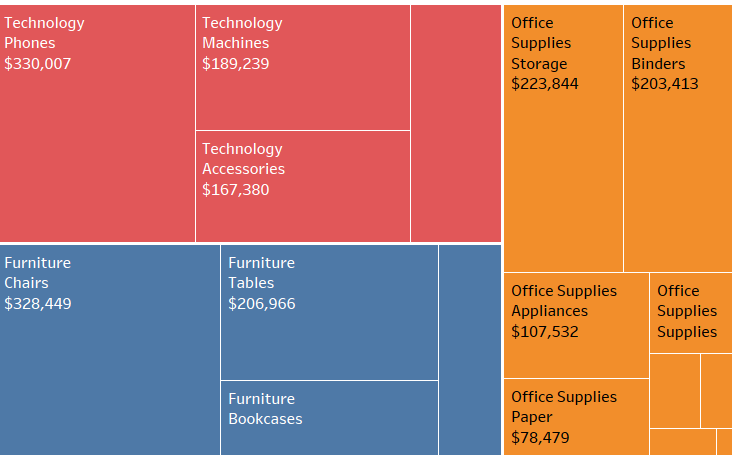
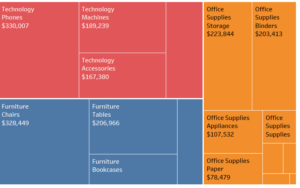
This is what appears when we bring Category to the Colours mark.

Adding Category into the colour divides our original treemap into three grids and each grid is further divided into Sub grids ( subcategories in this case).
I hope you guys enjoyed this and would suggest you to try out treemaps with different combination and interpret the result.
Ping back for any queries.
Thanks,
Rahul Singh
