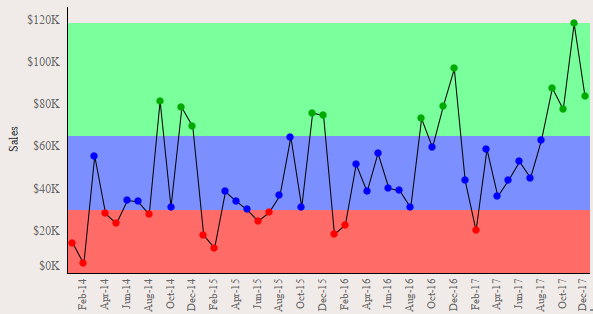
In the last article under Analytics Pane we discusses about Cluster Analysis in Tableau. Today we will see another option available under the Analytics Pane , Reference Bands.
Reference bands shade an area behind the marks in the view between two constant or computed values on the axis.They typically highlighting the range of values in a section of the view. They cover the area between two relevant values, such as average and median, or minimum and maximums, which are illustrated in the next example.
Now as we know what a reference band is , lets try creating one and see how does it work in tableau. Lets start by creating a simple reference band and then move a bit forward and see how we can use them effectively.
From our Sample Superstore data lets drag sales to rows and Order Date to the columns tab. Right click on the order date and select the continuous month ( the one that appears second in the dropdown ). Our view will be like this :
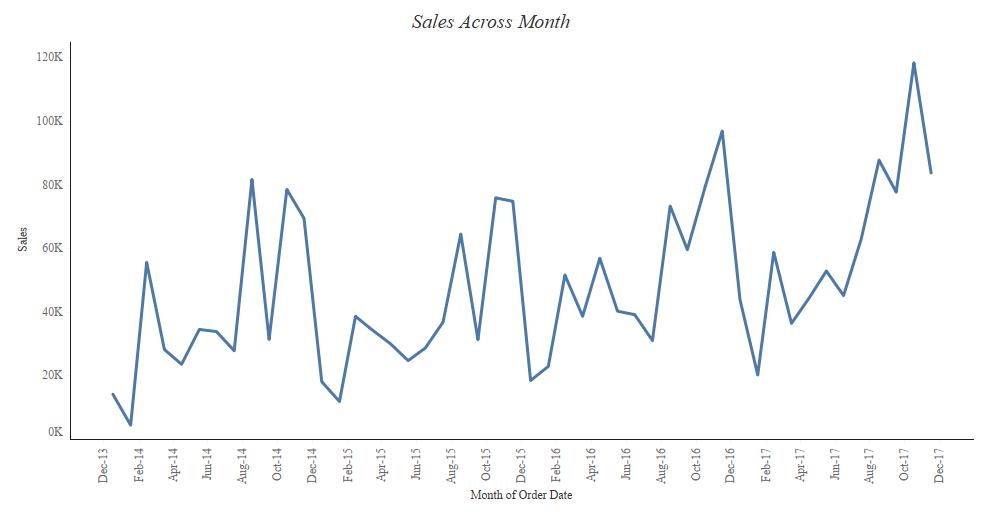
Go to the analytics pane and under the Custom heading click on reference band and drag it to the worksheet. Place it on the sales measure on the entire table . As soon as you place it on the worksheet you will get a popup window as under:

The above window allows us to select the area for which we want the reference band. In the above window under the Band to section select average instead of Maximum, change the color under fill and click on OK. Your view will now change to the following :
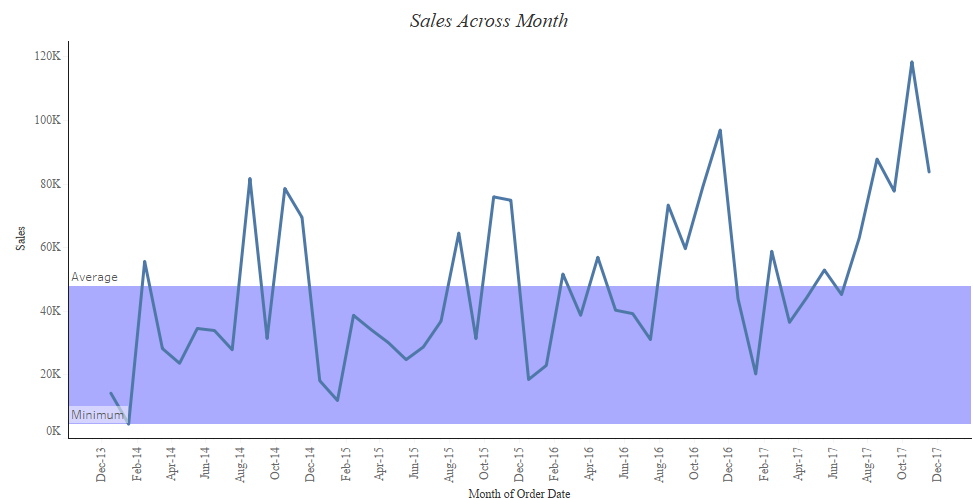
We have our reference band ready. We see that the area between the minimum sales and the average sales now gets highlighted by a different color of our choice. Multiple reference band can be added to the same worksheet.
Lets go ahead further and try to add multiple reference band and see how it works. Let us say that we want to see the months that are having sales more or less than a target value ( that can be chosen by the user ) and we would like our reference band to adjust accordingly to the target value.
Click on the reference band that we just created and select remove. This will bring us back to our initial view of sales across month.
Create a parameter for target sales as under :

Right click on the parameter Target Sales and select show parameter control to bring it on to the worksheet.
Go to the analytics pane and again drop the reference band on the Sales for entire table.
We will again have the same popup that we had earlier. In the popup select Target Sales as value under Band From and in the Band to section select constant and set the value to be 0 . Select a shade of red in the fill option.

After you click on OK , you will get the following on your screen:
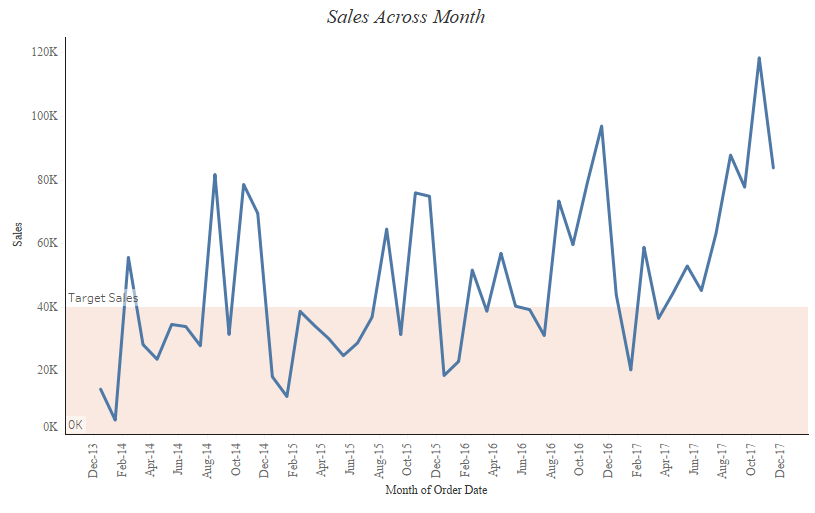
Lets add another reference band to our worksheet. This time we will have band from the Target sales to the maximum sales . This is how the popup window should look like:
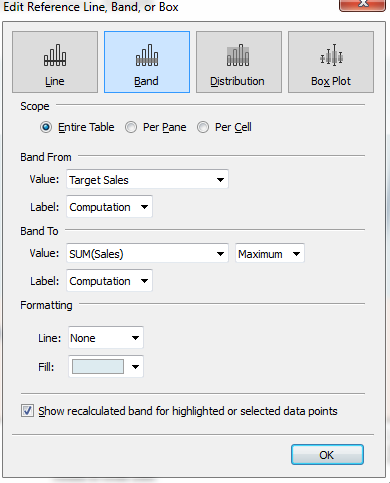
Once you click on OK we will have another reference band from the Target value to the maximum value . The target value can be changed from the parameter and our reference band would adjust accordingly.
Hope this helps.
Here’s a tableau workbook in which I have used three reference bands to categorize the sales as low , medium and high ( the values of which can be chosen by the user ). Have a look and try to recreate it . Let me know if you have any issues in recreating it.
Thanks!!
