Parameter Actions Part 4 : Swap Sheets
In this blog post we will look into another use case of Parameter actions in Tableau – Swapping sheets. In the earlier blog of this […]
In this blog post we will look into another use case of Parameter actions in Tableau – Swapping sheets. In the earlier blog of this […]
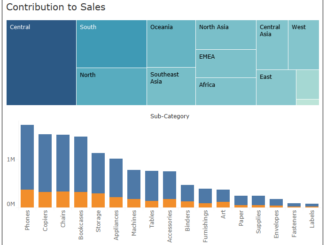
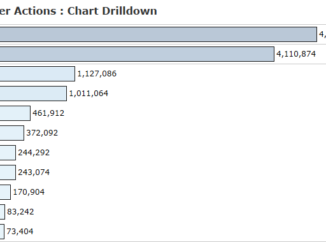
In the previous two blog posts we looked into how to use parameter actions for Comparing Values and Enabling drilldown in charts. In this blog […]
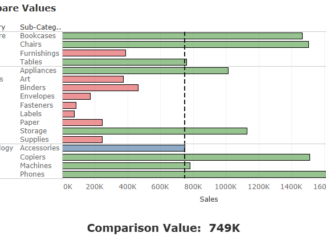
In the last article we learned how to use parameter actions to enable chart drilldown. Today we would learn how to use a parameter to […]
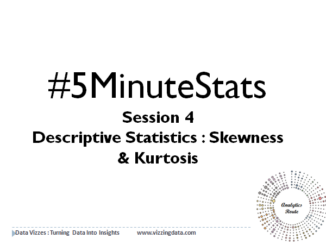
Here is a five minute video about skewness and kurtosis and how to interpret these values in a dataset.
Parameter actions were introduced in Tableau 2019.2 and these can be used in multiple scenarios. You can read more about them here. This blog post […]
Here is a 5 minute video about the different measures of dispersion.
This short video gives a brief introduction about the most common measures of central tendency : Mean, Median and Mode
Here is a five minute video on Introduction to Stats and the two broad classification of statistics.
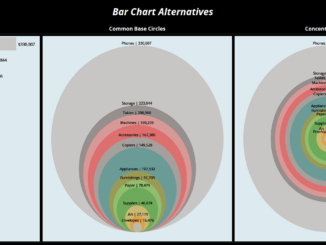
There is no denying fact that we all love to create new dashboards in tableau. Why not it’s a fun activity. We put on extreme […]
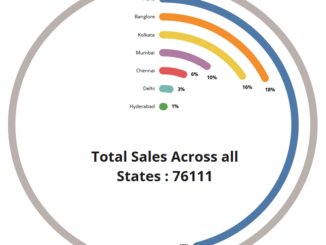
In this blog I will walk-through the steps of creating Tableau Rings. For the Makeover Monday Challenge ( those who do not know about the […]
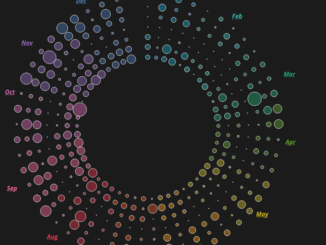
Hoping that you guys enjoyed the previous blogs regarding Visualizing Time series and Circles with common base. Continuing to our posts on Circles , here […]
Hi every one. In the earlier blog we discussed about how to represent a time series data on a radial chart. This post is also […]
Copyright © 2026 | WordPress Theme by MH Themes