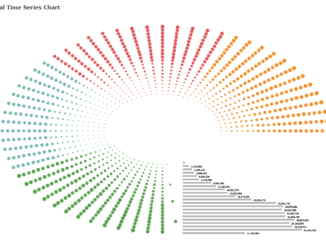
Visualizing Radial Time Series Data To Uncover Patterns in Tableau
First of all A Happy New Year and decade to all those who are reading this. Last year was quite a busy one and I […]
First of all A Happy New Year and decade to all those who are reading this. Last year was quite a busy one and I […]
Connect Tableau with R – Get Beauty with Power Tableau, as we all know, is the go-to tool for visualization, today. R is an open-source […]
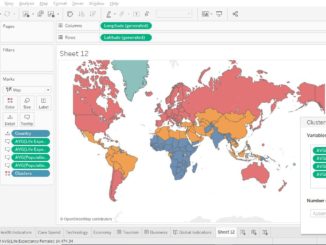
Clustering is grouping similar observations or data points of similar measures. Clustering helps our daily businesses in many ways. Let’s see an example, there are […]

Dashboard to its user is what an assistant is his boss. While an assistant helps in managing multiple tasks for his boss, dashboard helps in […]
Hi All, This post is the first in the series where I will be discussing with tips and trick to enhance your tableau dashboard and […]
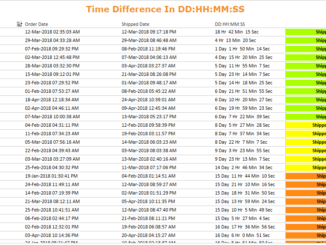
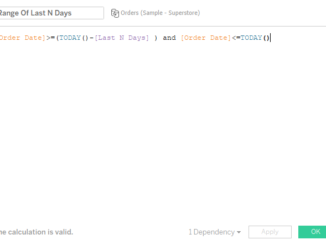
Hello All, Today in this blog we will cover a interesting scenario – Calculating the difference between two date-times and displaying the results in the […]
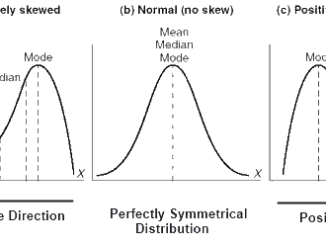
In statistics, a central tendency (or measure of central tendency) is a central or typical value for a probability distribution. It may also be called […]
Extracting Benefits of the Duo: Tableau and R Tableau is one of the best business intelligence tools available in the market at present. It has […]
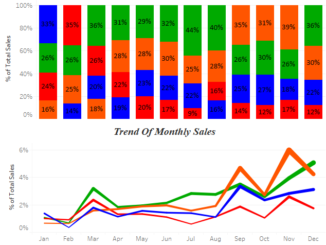
Hello Folks, In this blog I will show you how to sort stacked bar charts. Sorting of stacked bars charts enable us to see the […]
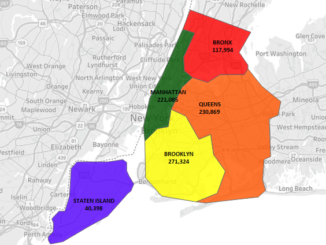
New York City encompasses five different county-level administrative divisions called boroughs: Manhattan, the Bronx, Queens, Brooklyn, and Staten Island. These are among the one of […]
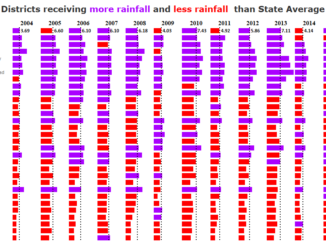
Rainfall are always random and it’s impossible for one to predict when and how much it would rain with complete accuracy. However one can definitely […]
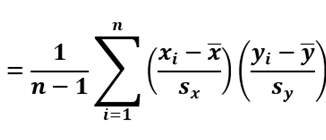
What is correlation? Correlation is a statistical measure that indicates the extent to which two or more variables are related. The measure of correlation between […]
Copyright © 2026 | WordPress Theme by MH Themes