
Rainfall are always random and it’s impossible for one to predict when and how much it would rain with complete accuracy. However one can definitely look for patterns and insights based on the historical available data.
This analysis is done on the basis of Daily Rainfall Data from 2004-2016 (for the months of June , July , Aug and Sep ) for Telangana state that is available on the Telangana Open Data portal.
The heatmap below shows how the average rainfall has been across the entire states for the rainy months from 2004-2016.
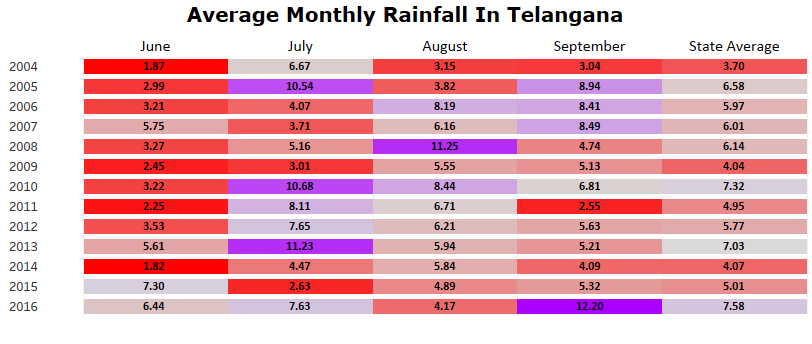
A quick look at the chart above tells us that most of the rain that happens is in the Month of July and August. Although rainfall generally starts from June , June relatively remains a dry month among the rainy months. 2004 was the driest year for the state with the average rainfall across the state being a mere 3.7mm . 2016 on the other hand was the most wet year for the state when the average rainfall was 7.58mm. Interestingly September was the month in 2016 when Telangana received 12.20mm of rain that is the maximum rainfall in the observed time frame.
Lets have a look how Hyderabad had rain in the year 2012
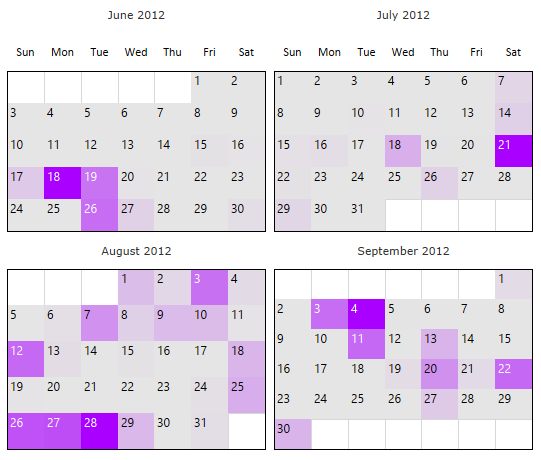
There an interesting observation when we talk about rains in Hyderabad, Only in the year 2012 , Hyderabad had no rain for the first two weeks on June, except for the year 2012 it rained at least once in the first week of June every year.
During the 2016 rainy season Hyderabad received the maximum rain on 1st Sep (84.28mm) .
Here’s the interactive viz where you can have a look at the daily rainfall for a specific district in a particular year :
A few insight are observed when we have a look at the rainfall by district and then compare the district average to the state average. Here the chart that shows the same:
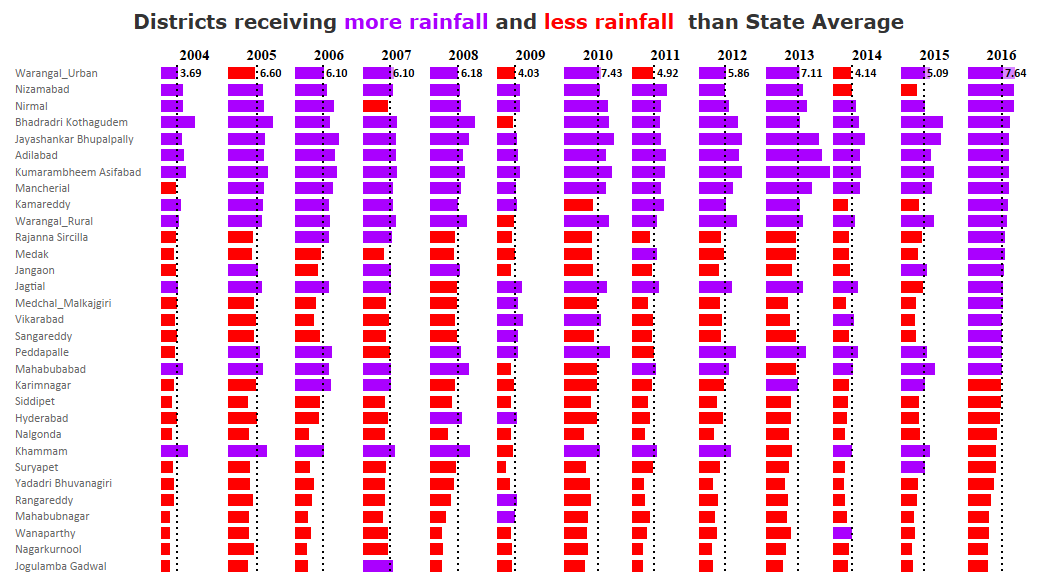
The above chart compares the average rainfall for each district in a year to the state average in that year. State average every year is represented by the dotted lines and the value of the average rainfall state had received is just beside the dotted reference line. The districts are ordered in descending order by the average amount of rainfall they received in 2016.
Blue denotes average rainfall more than state average which red denotes the opposite. In the year 2016 as we can see the average rainfall the state received was 7.64mm . It was only in this year when 19 districts out of 31 had rainfall more than state average. In the year 2004 this number was just 12.
If we have a close look into Hyderabad we see that Hyderabad generally receives less rainfall than the sate average. The only instances when Hyderabad received more rain than the state average was in the year 2008 and 2009.
Jayashankar Bhupally, Adilabad and Kumarambheem Asifad have always recived more rain than the state average.
They are closely followed by Nirmal, Bhadradri kothagudem and Macherial which have received more rain than the state average everytime except for one year.
Well this was all for now. Lets all hope we Hyderabadis break the record of rains in 2016 this time,
I know it’s a bit early , summers are yet to start 😛