
In this blog post we will look into another use case of Parameter actions in Tableau – Swapping sheets. In the earlier blog of this series we saw how to use parameter actions to compare values, show contribution and Enabling Chart drill-down. If you have not read it yet you can do so by visiting the blogs here.
Before parameter actions swapping of sheets was achieved using parameter drop-down. With parameter actions this activity is more seamless and can be achieved by a single click rather than selecting the sheets from the drop-down. So lets get going and see how to achieve this. We would once again use our Sample super store data for this. Lets follow the steps below to see how sheets swapping is done using parameters
Step 1 : Connect to Sample super store data.
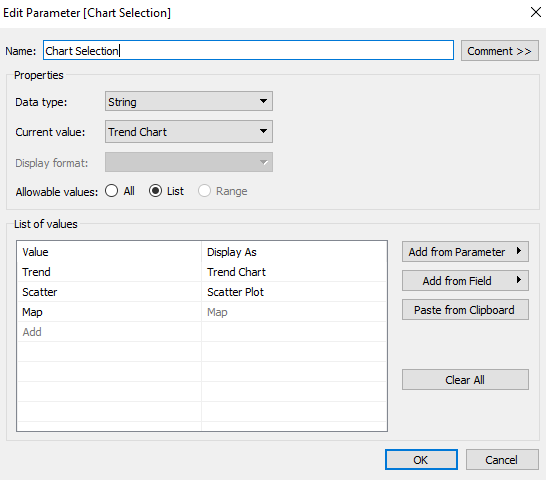
Step 2: Create a parameter as under to swap between the sheets.
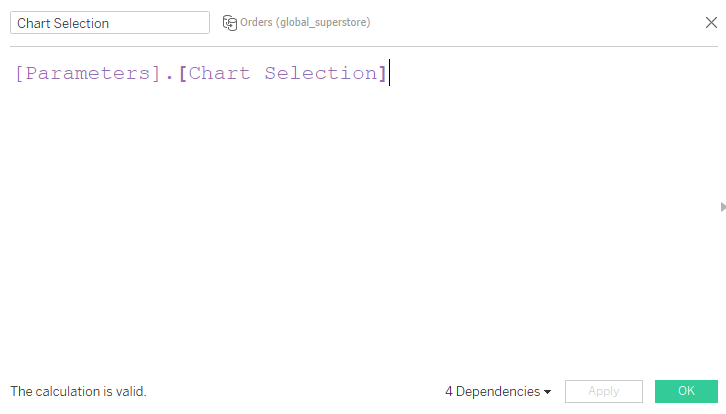
Step 3: Create a calculated field to pass the value of our created parameters as under:
Step 4: Create three basic charts. For our purpose we will create the following views :
a- Monthly trend of Sales: Bring order date to the columns, right click and from the drop-down select Month . Next bring sales to the rows to get the monthly trend of sales. Name this workbook as trend chart.
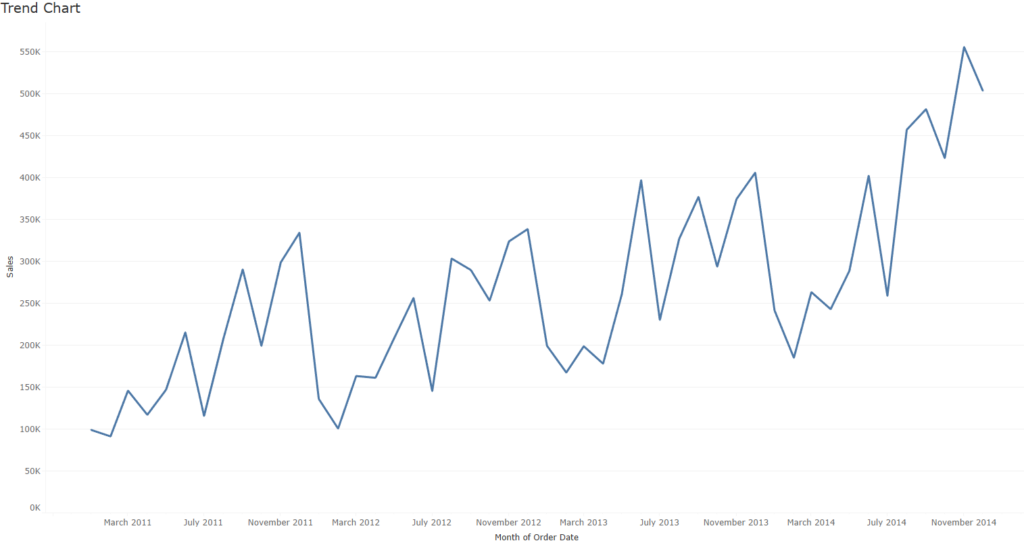
Right click on the created parameter and click on show parameter control. Next select Trend Chart from the drop-down. Bring the calculated field (Chart Selection) to the filter and click on Trend Chart.
b- Scatter Plot : Go the the next worksheet to build a scatter plot between Sales and Profit. To do this drag the measures Profit and sales to columns and rows respectively. Once done bring the Order ID field on to the details marks to have the scatter plot.
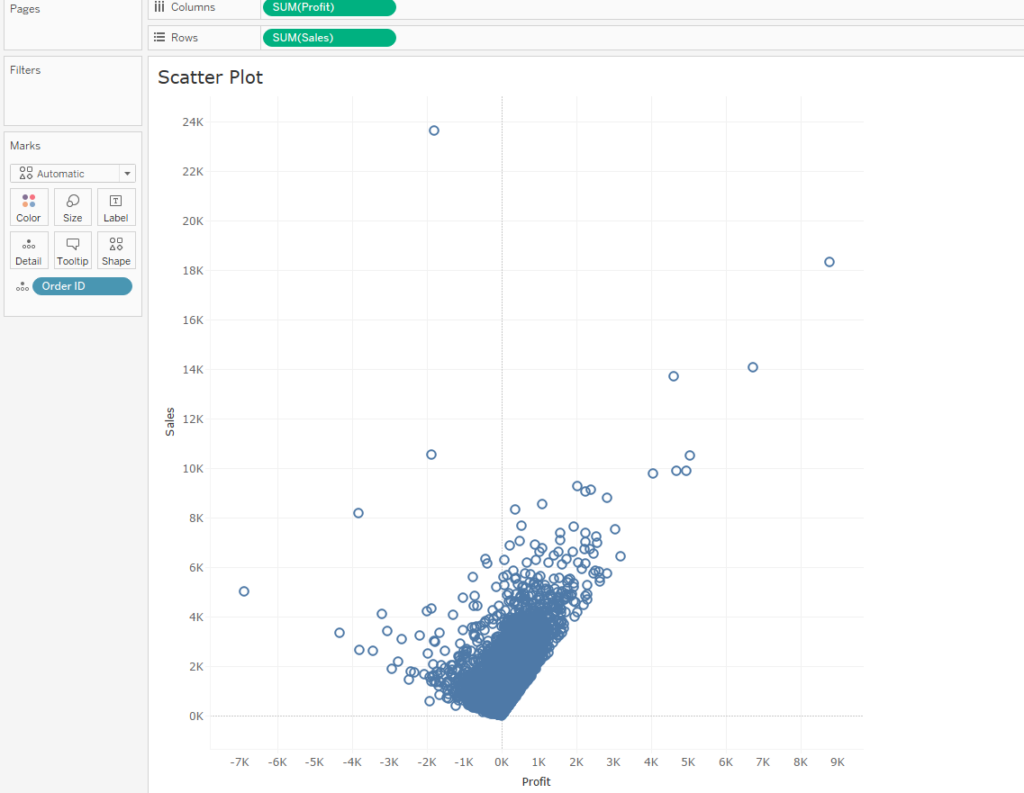
Similar to the earlier step right click on the parameter and show paramater control to view the parameter on this sheet. Once done select Scatter Plot from the dropdown and place the calcuated field
c. Map Plot : Similar to the above steps create a basic chart with a map view. Remember to select the parameter control as Map for this and in the filter check on the map option.
Step 5 :Creating buttons for sheet swap.
Import an excel file with the following columns as a new data source.
| Type | X | Y |
|---|---|---|
| Trend | 1 | 1 |
| Scatter | 1 | 2 |
| Map | 1 | 3 |
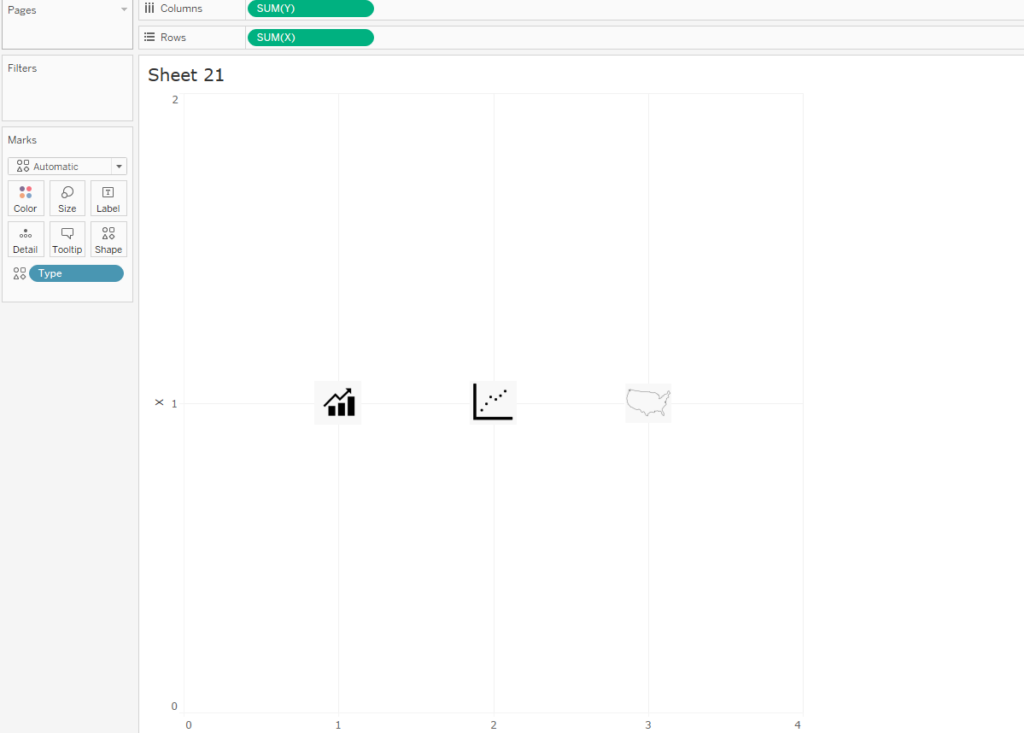
Once this sheet is imported in Tableau drag X to rows and Y to columns. Drag the feild Type on to the detail marks and now you can see your sheet would be having three data points. Change the mark type to shape and select different shapes for the three data points. In my case I have used three icons instead of the default shapes that comes in Tableau.
Step 6: Create a new dashboard and from the layout drag a vertical container onto it. Next place the three sheets ( trend , scatter and map ) in the container. Make sure that you hide the sheet titles that appear on the dashboard and for each of the individual sheets the option fixed height is unchecked. Now once these three sheets are on the dashboard , try changing the parameter , you will see that as you change the parameter values the sheets swap.
Step 7: In this final step we will bring the sheets with icon on the dashboard and then add a parameter action as under to enable sheet swapping by a click on icons as under:
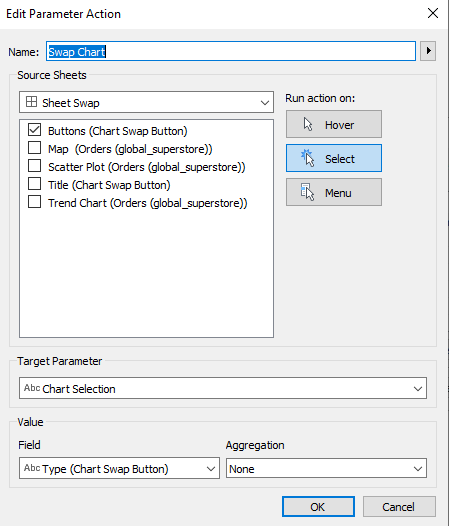
Once you hit on OK, your parameter action is live and you can swap sheets using just the icons. Here is an interactive version of the tutorial that we discussed above.
As a task I have left the Title part of this for you all to give it a try.
Let me know in case if you have any issues in following the step. Hope you guys enjoyed the tutorial . Stay tuned for more on Parameter action.
Happy Learning!!
Hi! Thanks a lot for your tutorial, but what about legends?
I’ve tried to solve the same case but i had a problem with legends.
For example, if I use legend which looks like gradient and when I try to swap list, my legend doesn’t become hide but has ‘null’ instead normal values.
Do you have any ideas for fixing it?