Designing all device-compatible Tableau dashboards
Dashboards: Dashboards are used to present one or more views, often with filters, legends, and interactivity with all views together. Dashboards help us to explain […]
Dashboards: Dashboards are used to present one or more views, often with filters, legends, and interactivity with all views together. Dashboards help us to explain […]
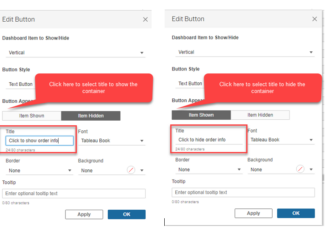
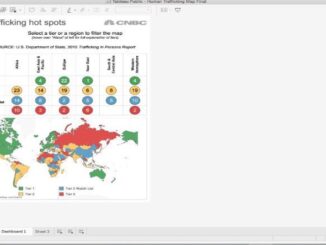
In this blog we are going to discuss how to create a collapsible container. From version 2019.2 , tableau had added a new feature in […]
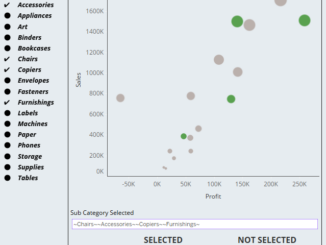
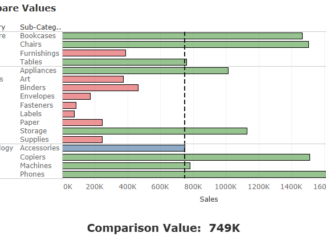
In the earlier blogs about parameter actions we discussed several use cases like sheet swap, compare measure, swap measure , synchronized scroll and others. In […]
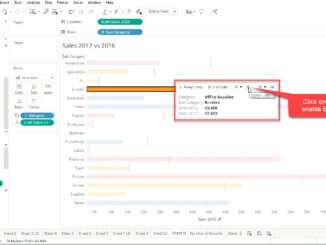
Explain data is a powerful feature that’s come into tableau which lets you deep dive into your data. You can use it inspect , uncover […]
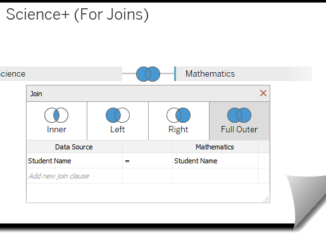
The data we analyze mostly does not reside in on single table. Instead the information that we are looking for may be present in other […]
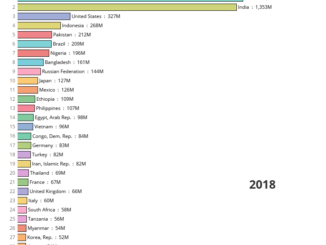
In this blog we will learn how to use the latest feature in Tableau to create a race bar charts. Race bar charts are the […]
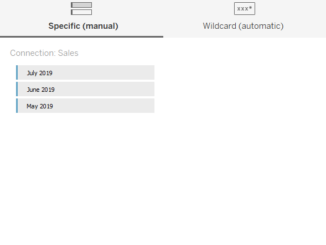
In this blogpsot we will understand how to union our data in Tableau. My earlier posts were about parameter actions and we learned how to […]
In this blog post we will look into another use case of Parameter actions in Tableau – Swapping sheets. In the earlier blog of this […]
In the last article we learned how to use parameter actions to enable chart drilldown. Today we would learn how to use a parameter to […]
Here is a five minute video about skewness and kurtosis and how to interpret these values in a dataset.
Here is a 5 minute video about the different measures of dispersion.
This short video gives a brief introduction about the most common measures of central tendency : Mean, Median and Mode
Copyright © 2026 | WordPress Theme by MH Themes