
In the earlier blogs about parameter actions we discussed several use cases like sheet swap, compare measure, swap measure , synchronized scroll and others. In case you have not yet gone through them you can find them here.
In this blog we are going to discuss a super useful use case for parameter actions – Multi-select parameters. This post is inspired from the work of Lindsey Poulter. You can also check out the workbook that she has which contains some example of using parameter actions here
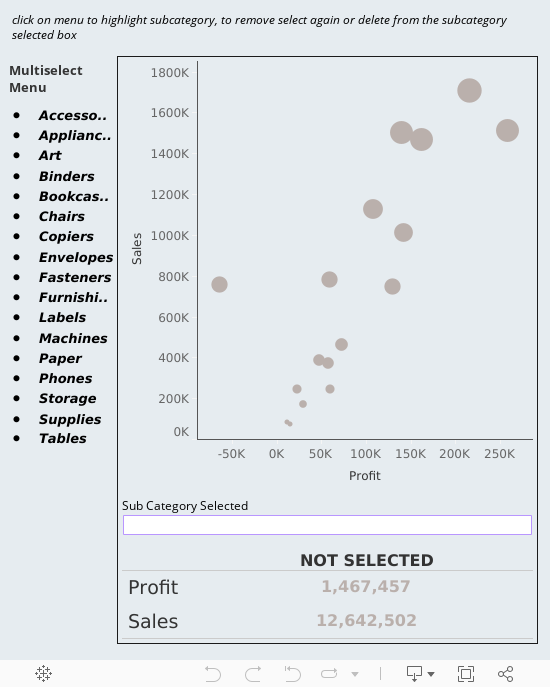
Parameters are the most useful feature that I have come across in tableau. They take the interactivity of the viz to a whole new level. Parameters had a limitation – for parameters we cannot multiselect the values. However with the new feature of parameter actions this is also now possible. Lets have a look and try to implement this with our sample superstore data. Let us suppose we have a scatter plot of sales by profit for the sub-categories as under:
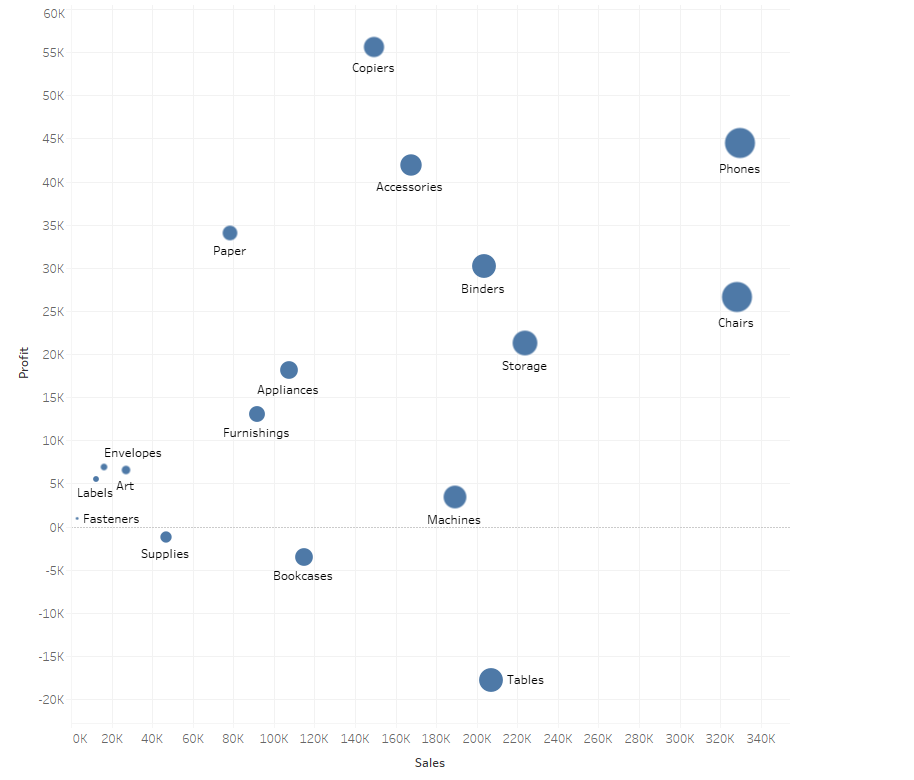
Our goal now is to select multiple subcategories and use a different color to highlight them. If we were asked to select just one sub category and highly them we could use a simple parameter and got it. But since here the selection is multiple we would use parameter actions. Lets go through this step by step and see how we can do this.
Step 1 : Connect your sample super store data and the create a scatter plot as mentioned above by dragging sales to rows, profit to columns and sub categories to details.
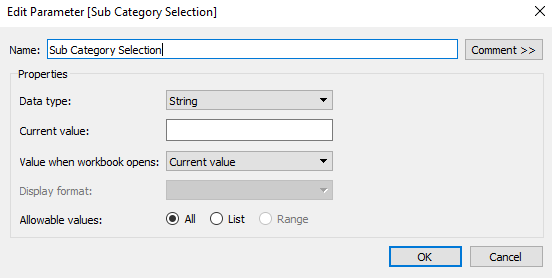
Step 2 : Create a parameter for selecting the sub categories. Make sure it’s a string parameter and in Allowable values all is checked.
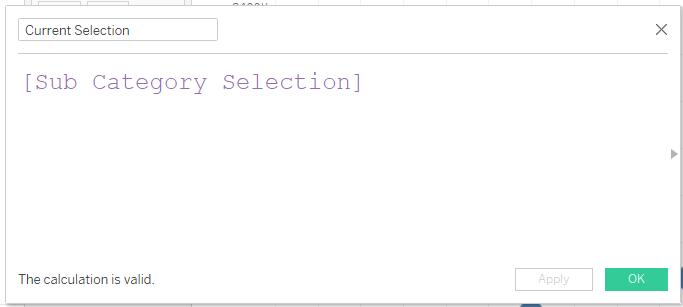
Step 3 : Create a calculated field to pass the value of parameter ( subcategory which is selected )
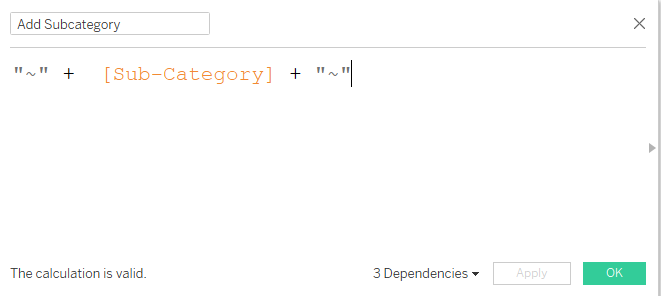
Step 4 : Create a calculated field as under to add ~ to the subcategory.
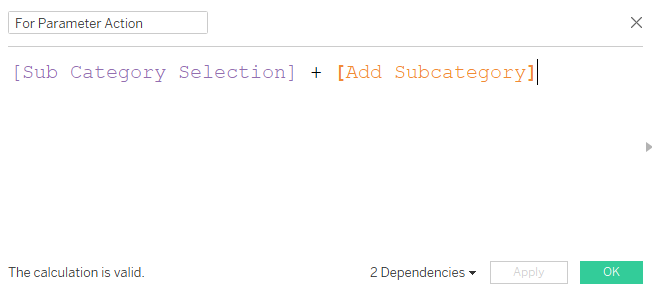
Step 5 : Create a calculated field to add the above value to the parameter selected. We will pass parameter action on this field.
Step 6 : Create a calculated field to create the buttons for selected subcategories and non selected as under
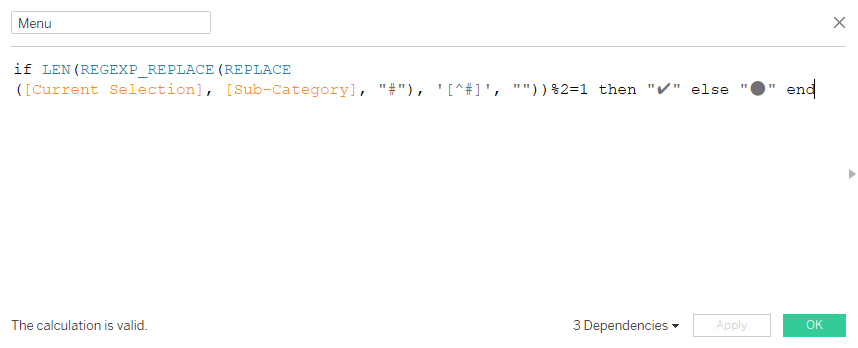
This field takes into account the selection if the sub category is clicked once (or odd number of times) , else is considers it as unselected. The symbols that you see in the calculation are actually UNICODE characters.
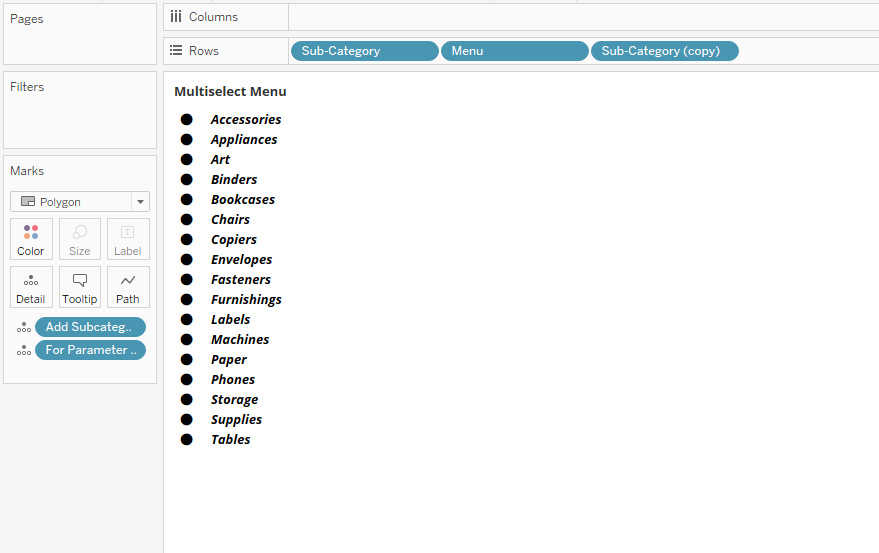
Step 7 : Creating the menu sheet.
Create a copy of sub-category. Next add Sub-Category, Menu and Sub-Category(copy) in the rows. Right click on Sub-Category on rows and uncheck the show header option.Add The two calculated fields (Add SubCategory and For parameter actions to the details mark) You will now have your sheet as under:
Now bring the two sheets in a dashboard and create a parameter action as under.
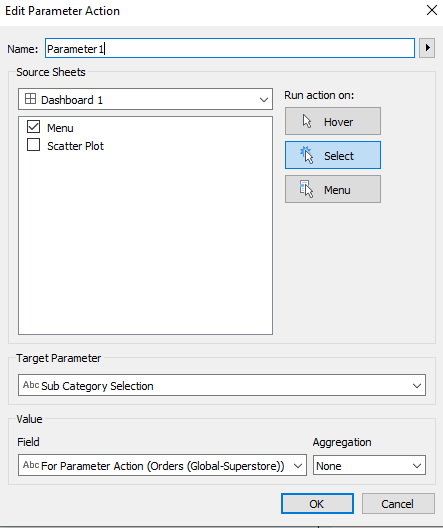
That’s it. Now once you click on the menu sheet on any of the subcategory , you will see the sub categories in the scatter plot to be highlighted.
The Challenge
Create a worksheet that compares the values of sales and profit for the selected marks. Here is an interactive version of the dashbaord,
Hope you guys enjoyed the post. Reach out to me at rahul@vizzingdata.com in case if you have any issues. And last but not the least , do subscribe to our newsletter on homepage in case if you have not yet to get notifications via emails as soon as we publish new blogs.
Also you can join us on our Telegram Channel https://t.me/vizzingdatadiscussion
Happy Learning!
i did this visualization along with the challenge part,
click on the link for the dashboard
https://public.tableau.com/profile/soumyaranjan.sahoo#!/vizhome/MenuSelection/MenuSelection