Introduction to Parameter Actions
This video gives an introduction to the feature of parameter actions in Tableau and how to use them in your dashboard to make them more […]
This video gives an introduction to the feature of parameter actions in Tableau and how to use them in your dashboard to make them more […]
In the earlier blogs about parameter actions we discussed several use cases like sheet swap, compare measure, swap measure , synchronized scroll and others. In […]
Explain data is a powerful feature that’s come into tableau which lets you deep dive into your data. You can use it inspect , uncover […]
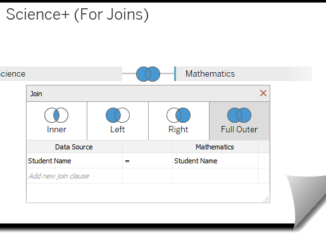
The data we analyze mostly does not reside in on single table. Instead the information that we are looking for may be present in other […]
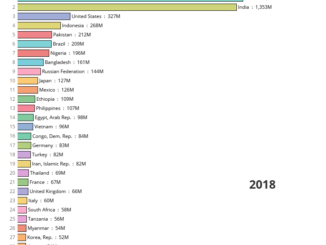
In this blog we will learn how to use the latest feature in Tableau to create a race bar charts. Race bar charts are the […]
In this blogpsot we will understand how to union our data in Tableau. My earlier posts were about parameter actions and we learned how to […]
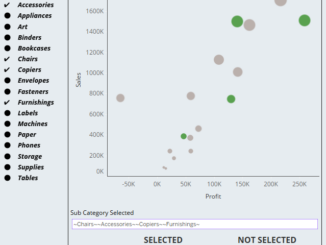
We have seen multiple use cases of Parameter actions in Tableau in our last blogs. In this blog post we will look into another useful […]
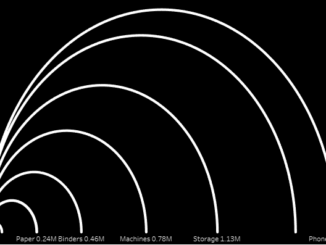
In this blog we are going to discuss how to create an arc chart in Tableau. Arc charts can be considered as an alternative to […]
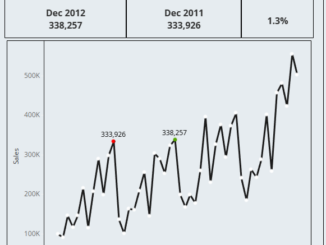
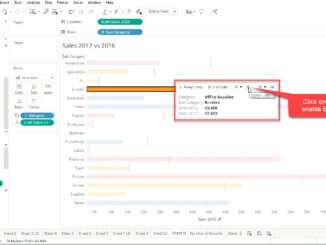
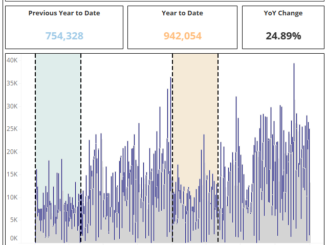
In this seventh part of the series parameter actions we will see how to use parameter actions to compare sales of a month one year […]
In the earlier part of this series parameter action we discussed about using them for multiple scenarios such as chart drilldown , swap sheets and […]
In this series of parameter actions we will look into how to swap between measures. In the previous posts of the series of parameter actions […]
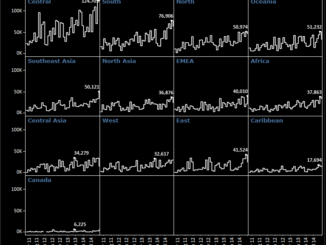
In this blog we will learn how to create Small Multiples chats also called as Trellis charts in Tableau. Let us first understand what a […]
Copyright © 2026 | WordPress Theme by MH Themes