
Market Summary 9th Feb 2026
Daily Market Radar DAILY MARKET RADAR Monday, 09 February 2026 ⚡ Market Pulse: The strong advance-decline ratio suggests broad-based market participation and bullish sentiment, supporting […]
Daily Market Radar DAILY MARKET RADAR Monday, 09 February 2026 ⚡ Market Pulse: The strong advance-decline ratio suggests broad-based market participation and bullish sentiment, supporting […]
Daily Market Radar DAILY MARKET RADAR Thursday, 05 February 2026 ⚡ Market Pulse: **Market One-Liner:** Broad market weakness prevails as evidenced by a negative advance-decline […]
Daily Market Radar DAILY MARKET RADAR Wednesday, 04 February 2026 ⚡ Market Pulse: Nifty is showing moderate gains, but the significantly positive Advance/Decline ratio suggests […]

For decades, the narrative was clear: China would inevitably overtake the US economy. New data shows that narrative is dead. Dive into this three-part data visualization series analyzing the stalled rise of China, the surprising resurgence of the USA, and India’s unique path to $7 trillion.
A 62% GDP boom in one year. A 75% economic collapse in a decade. And the exact moment the ‘Emerging’ world overtook the West. We visualize the raw data behind the three trends defining the new, unstable global economy
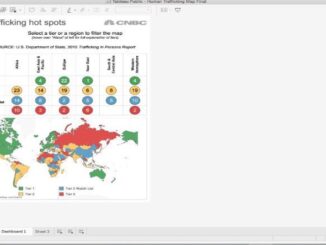
Dashboards: Dashboards are used to present one or more views, often with filters, legends, and interactivity with all views together. Dashboards help us to explain […]
A very happy new year to all of you out there. I hope the last year was great for you all and this year brings […]

Ever wondered how to create a dynamic reference band in Tableau . Here’s a tutorial about it using set actions. Hope you guys enjoy it […]
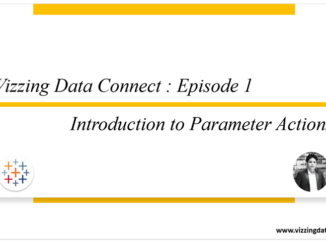
In this first connect we discussed what are parameter actions and how to use them to make our dashboard more interactive.
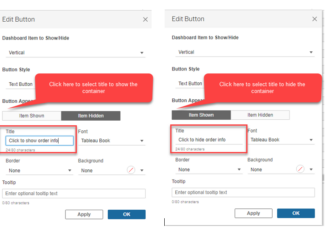
In this blog we are going to discuss how to create a collapsible container. From version 2019.2 , tableau had added a new feature in […]
This video explains the basic difference between sets and groups and where to use them depending on the scenario.
In this video we will go through the feature of set action in Tableau and see how to use them in our dashbaords.
Copyright © 2026 | WordPress Theme by MH Themes