Data Vizzes

Data Vizzes

Turning Data Into Insights

  • Home
  • Tableau Tutorial
    • Tableau Basics
    • Tableau Charts
    • Tableau Calculations
    • Tableau Tips
    • Tableau Advanced Charts
    • Video Tutorials
  • Statistics
    • Introduction
    • #5MinuteStats
  • Learning R
  • Open Data Journalism
  • My Portfolio
  • Interactive Me

Indian Statistics

Debunking the Myth Of Digital India

August 11, 2017 Rahul 0

India Vision 2020 was a document that was prepared by the Technology Information, Forecasting and Assessment Council (TIFAC) of India’s Department of Science and Technology […]

How Successful has been the Swachh Bharat Campaign In Rural Elementary Schools , especially for Girls ? ?

August 9, 2017 Rahul 0

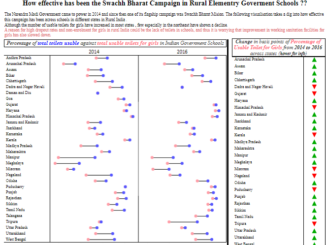
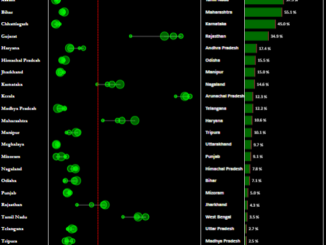
The BJP Government came into power in 2014 with a thumping majority and since then one of its flagship campaign was the Swachh Bharat Mission. Swachh […]

Literacy Rate In India

July 9, 2017 Rahul 0

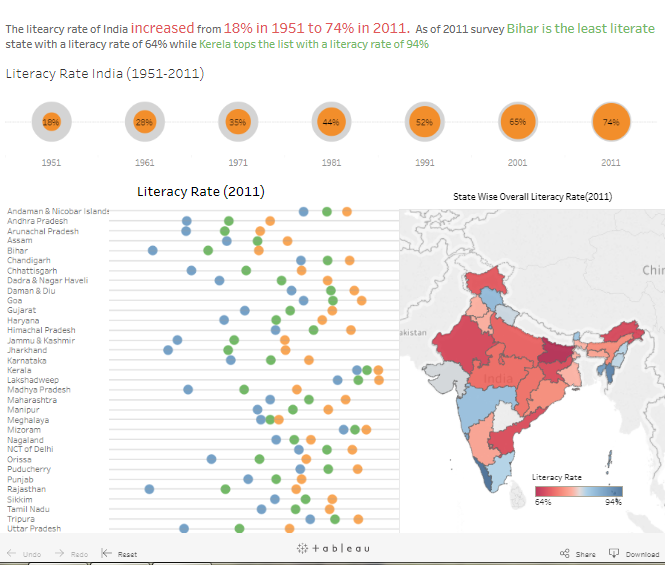
Literacy rate in India increased from a mere 18% in 1951 to  74% as of 2011. As of 2011 Bihar was the least literate state […]

Lok Sabha Seat Distribution

July 9, 2017 Rahul 0

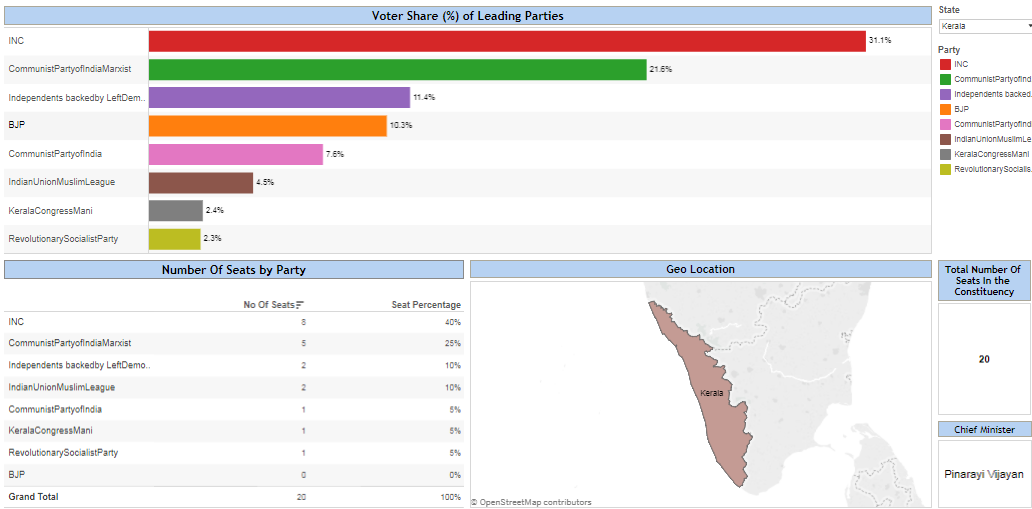
Members of the 16th Lok Sabha were elected during the 2014 Indian general election. The elections were conducted in 9 phases from 7 April 2014 […]

Please follow & like us :)

YouTube
YouTube
fb-share-icon
LinkedIn
LinkedIn
Share
Twitter
Visit Us
Follow Me
Post on X
Telegram
RSS

Subscribe to our mailing list

Loading

Categories

Recent Posts

  • Designing all device-compatible Tableau dashboards
  • Publish a Workbook : Tableau
  • Dynamic Reference Bands : Set Actions
  • Vizzing Data Connect Episode 1
  • Tableau Tip : Show/Hide Containers
May 2025
S M T W T F S
 123
45678910
11121314151617
18192021222324
25262728293031
« Aug    

Archives


Tags

calculation (1) charts (1) Circular Calendar (1) Comparing Dates (1) Concentric Circles Tableau (1) Dashboard (1) date functions (1) Group (1) Indian Statistics (2) LOD (1) Makeover Monday (4) News Makeover (1) Onion Ring Charts (1) Packed Circles (1) Parameter Actions (10) Radial Charts (2) Radial Chart Tableau (1) Set Actions (1) Sets (1) slope charts (1) Statistics (4) Tableau (4) Tableau Advanced Charts (14) Tableau Basics (5) Tableau Calculations (4) Tableau Charts (12) Tableau Rings (1) Tableau Spirals (1) Tableau Tips (8) Table Calculations (2) Uncategorized (2) Vizzing Random Data (3)

Categories

May 2025
S M T W T F S
 123
45678910
11121314151617
18192021222324
25262728293031
« Aug    

Recent Posts

  • Designing all device-compatible Tableau dashboards
  • Publish a Workbook : Tableau
  • Dynamic Reference Bands : Set Actions
  • Vizzing Data Connect Episode 1
  • Tableau Tip : Show/Hide Containers

Previous Posts

Contact Us

  • Email
    rahul@vizzingdata.com
  • Phone
    9912616315
  • Address
    Hyderabad

Copyright © 2025 | WordPress Theme by MH Themes

error

Enjoy this blog? Please spread the word :)

  • YouTube
    YouTube
  • fb-share-icon
  • LinkedIn
    LinkedIn
    Share
  • Twitter
    Visit Us
    Follow Me
    Post on X
  • Telegram
  • RSS