Hi All,
Today I am going to discuss about the Top/Bottom Option that tableau provides us with to filter the dimension.
Whenever we try to move a dimension field into filters mark a pop up box appears where we can select the states on the top/bottom criteria for Total Sales.
We all would have used it often but Individually like just display the Top N on a page or Bottom N on a Worksheet .
Today we are going to see how to represent the Top and Bottom on the same worksheet.
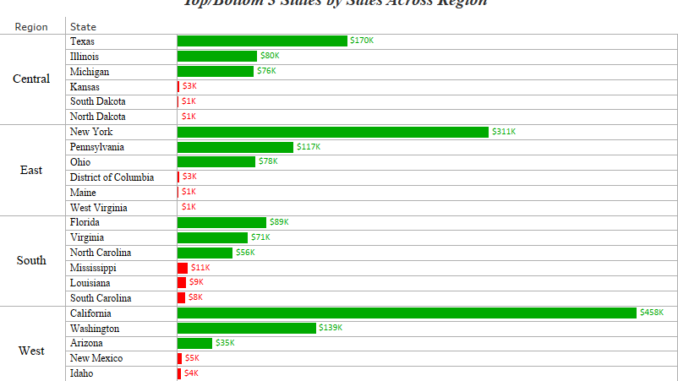
Let us say we want to see the top and bottom three states by sales in all the region in our superstore data set.
We will achieve this by using the Rank and the Size function in Tableau.
Lets get started and try to get the top 3 and bottom 3 states across region .
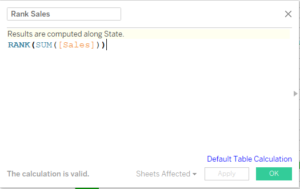
Step 1: Create a calculated field to compute the Rank.

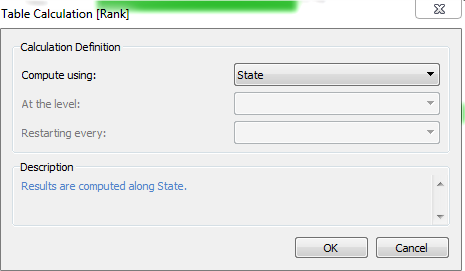
Click on the Default table calculation in blue in the box and select state,

Step 2: Create a calculated field to calculate the size . As done above with rank compute it across state.

Before we go further we will pause for a bit and discuss about Rank and the Size function. The Rank function assigns every state a rank on the basis of its sales and the size calculated the total number of states. So if a region has 12 states the value of size would be 12.
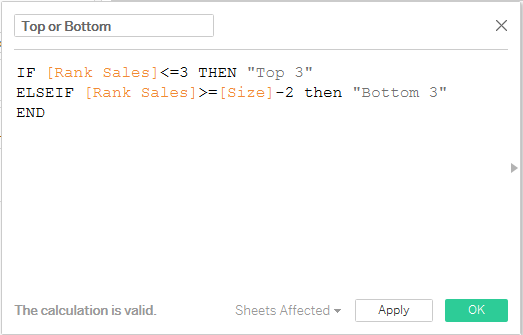
Step 3: Create a calculated field to identify the top 3 and bottom three states.

Step 4: Drag sales to the Columns shelf. Drag region and State to the rows shelf. Your screen will look somewhat like this :

Step 5 : Drag the calculated field Top or Bottom to the Filter mark , compute is using State and select the values Top 3 and Bottom 3 .
Bring this top or bottom to the color .
Format the chart and you are good to go . You will have now the top and bottom states across regions.
Instead of specifying the number of top and bottom we can also use a parameter to dynamically change them. The workbook below shows the Top/Bottom using a parameter.

Thanks a lot Madhu for pointing that out. The calculated field in Step 1 is Rank Sales and not Sales. I have updated the screenshot accordingly.