In the previous blog of this series we discussed about Line Charts . Today we will discuss about Area charts.
Area charts are constructed in the similar fashion as line charts. The only difference is that we have to select Area in the mark section instead of line.
Lets go ahead and create area charts and try to interpret what they mean.
Continuous Area Charts:
In the blog for line chart we discussed that the type of the chart is described by what is the type of date field that we are considering. The same case applies for area charts. To have a continuous area chart the Date dimension should be continuous.
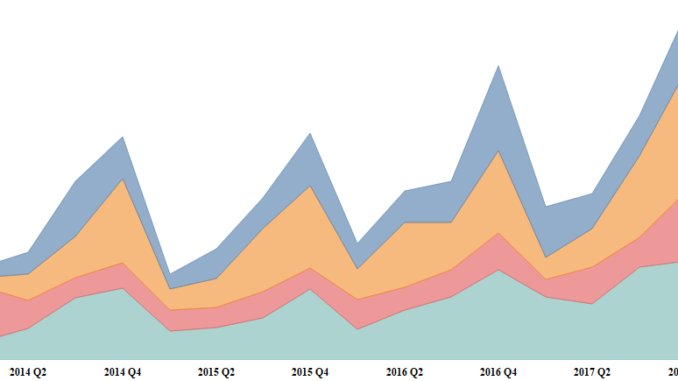
Drag Order Date into Columns. Right click on the order date and select Quarter that appears second in the dropdown. Bring Sales to the Rows and add Region to the color. You have a continuous area chart now.

Notice how the sales are distributed by area and West Region constitutes for most of the sales. Also we do see that the sales spike up at the Fourth Quarter every year, which could be due any factor like seasonality , more discounts towards end etc.
Discrete Area Charts:
To create a discrete are chart we should have the date dimension in discrete form.
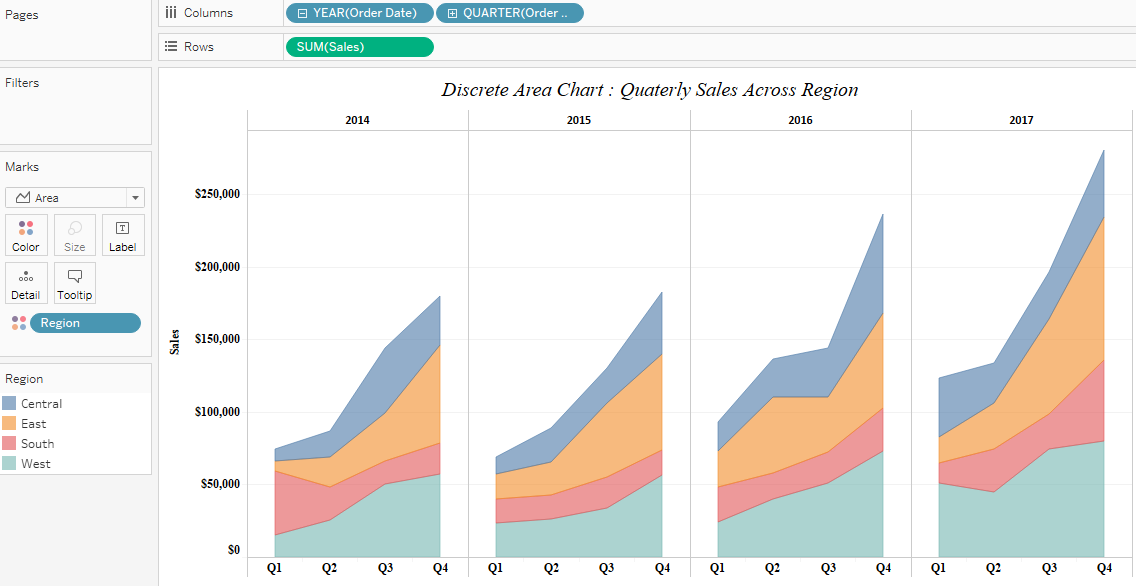
Drag order date to the Columns . Right click on the order date and from the dropdown select the first Quarter that appears. The color of the Date pill will change to blue which signifies that it is a discreet field.
Drag order date to Column and place it before the quarter pill. Bring sales to rows and add Region to the colors mark.
We now have a discrete area chart :

We see that in a discrete chart the quarter are divided by individual years.
Hope you guys are learning from these tutorials. Do mention in the comments if you like something to be added along with these.
Thanks
Rahul Singh
