Hi All,
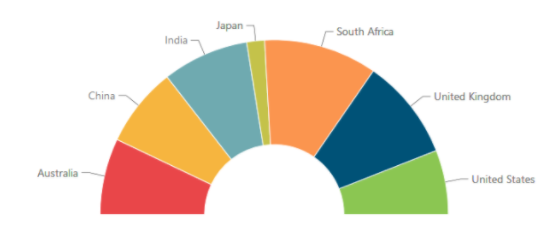
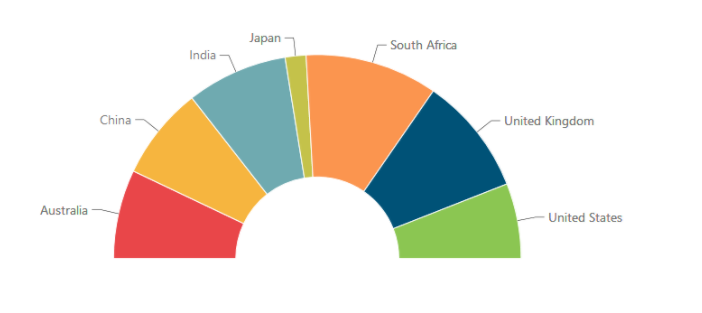
Yesterday I came across a scenario where some one on the tableau community has asked about creating this kind on chart in tableau :

In this blog I would talk about my approach with which we can achieve this in tableau.
This chart can be thought as a semi donot chart . For Information on donut chart checkout Donut Chart .
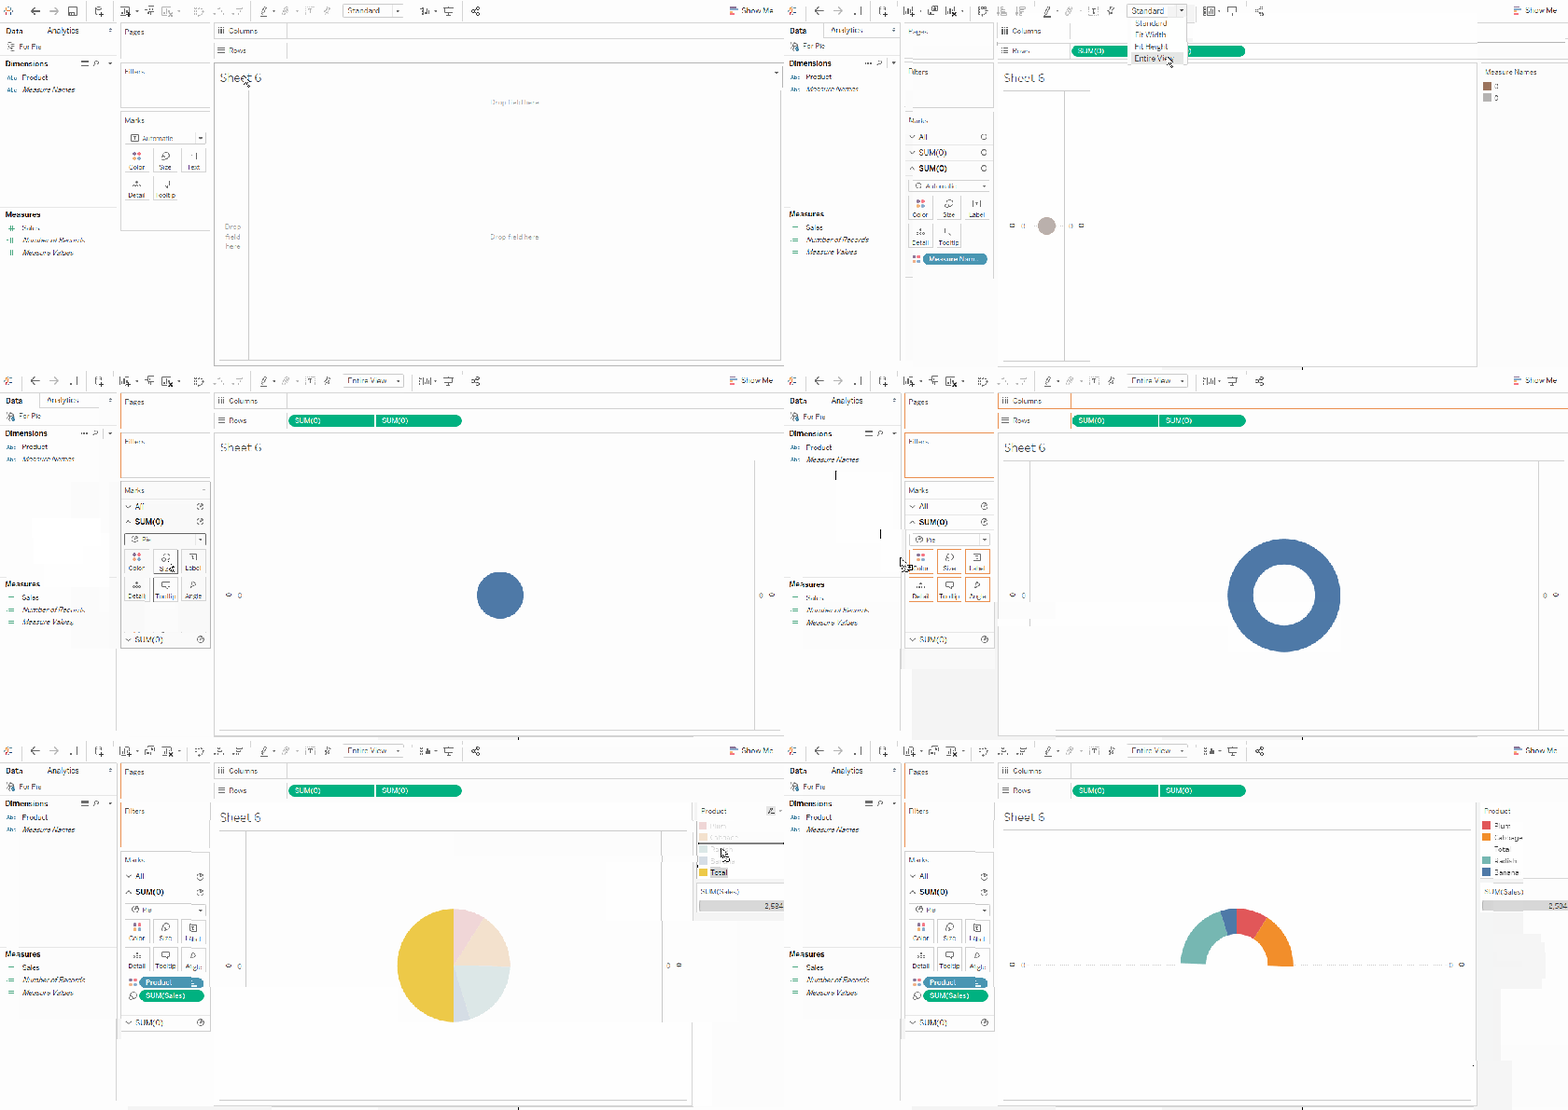
You can create a donut chart including the totals value of the , change the legend color for total and make it white , and adjusting the legends so that total comes in the lower semicircle.
Attached image describes the steps.

Please let me know if you are not able to follow the steps.
Please follow and like us:

Hi,
Thanks for this wonderful post. Could you please let me know, how to get total along with the measure value.
Regards,
Shruthi