In this blog I have tried to visualize the data which had information about Number of Recreational Visitors in Parks across US States.
The following were the measures and dimension in the data:
Park : Name of the park
Year : year of visit
Recreational Visitiors : No of people visiting the park
Park Type : Type of park eg Historic , Preserve etc
State : State were the park was located.

I came up with the following two vizes in tableau :
1 : I tried to represent the States (top 10 by number of parks) by number of Parks and the total number of recreational visitors in a 2X2 grid ( Low Visitors Less Parks , Low Visitors More Park , More Visitors Less Park , More Visitors More Park ) . I then tried to visualize how these States have moved across the grid in the last five decade.
Attached is the result:

The tableau workbook can be found at : States Across Grid
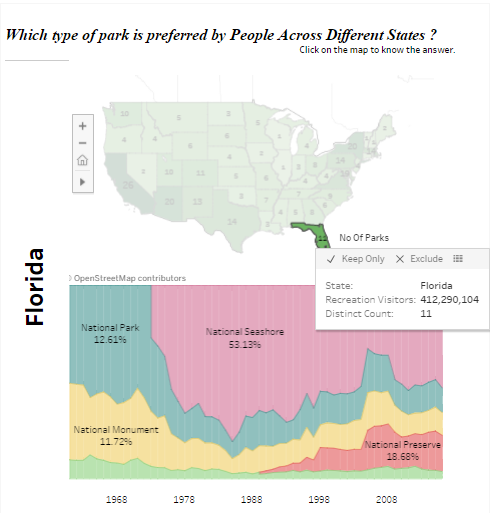
2: In this Viz I represented the Number of Parks in each state on the US Map and the area chart below the map showed the type of park with the most percentage of visits in that state.
The states can be selected by clicking of the Map

For example the above dashboard shows that In Florida most of the visits have been in National Seashore which makes sense as Florida being a coastal state
The tableau workbook can be found at : Park Preference By State
Thanks.
Rahul Singh
