
In the previous article under this series we discussed about Running Total , Difference and Percentage Difference.
We are going to continue of discussion on Quick Table Calculation and will be discussing about the following today:
1- Percentage Of Total
2- Rank
3- Percentile
4- Moving Averages
To look into these table calculations we will refer to our same table that we used in Part 1 . If you guys do not remember it lets create it quickly. Drag order date to the Columns and Sub Category to Rows. Place sales on the text mark and we are ready with our Sub Category sales table to perform the above table calculations .
Lets look into these individually:
1- Percentage Of Total
Percentage of total simple divides the value in the cell to the total value ( total for that row if measured across the table and total for column if measured down the table ). To add percentage of the total , right click on the sales measure and in the Quick Table Calculation select Percentage Of Total . This is what you should see on your screen now :

Lets try to understand what is happening here . When we applied percentage of total , tableau calculated row total for every sub category and then divided each number in the cell with the corresponding row total . So the first value 14.9% is actually calculated as 25014/(25014+40524+41896+59946 ) = 14.9% . Notice the sum of percentages across the rows is always 100% .
If we would like to see the percentage share of the subcategories year wise we would just compute the table calculation down the table in the Compute using option. In this case the sum of percentage across the columns would be 100%.
Percentage of total ,computed down the table:

2-Rank
The rank option sorts the measures internally and then provides rank to these entries . The one with the highest value is ranked 1 and the one with the lowest is ranked last.
Let’s see this in action. Clear the table calculation and change the format of sales to numbers. Right click on sales>>quick table calculation and in the options select sales.
This is what you should see on your worksheet now:

As we know by now that tableau computes any calculation across the table by default. So in this case tableau internally arranges the year of sales for the sub categories in descending order and ranks them. In our case the sales for Accessories was maximum in the year 2017 and hence we see a rank of 1 for year 2017. Similarly the sales for accessories was the least in the year 2014 and hence it is assigned a rank 4.
If we compute the rank down the table then the rank are assigned for every year to individual subcategories.
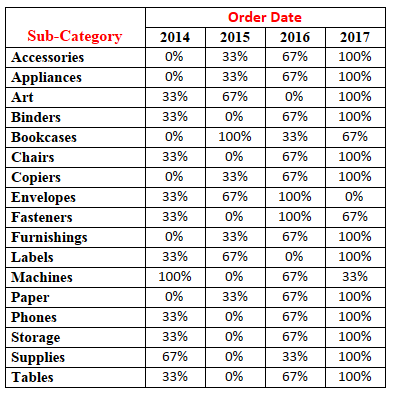
Rank (computed down the table)
![]()
This table ranks the subcategories in the year . For example in the year 2014 Phones accounted for maximum sales and hence have been ranked 1.
3- Percentile
Percentiles divide the data set into 100 equal parts. Percentiles measure position from the bottom. They are used to determine the relative standing of value in a list .
Clear the table calculation and now select the Percentile option to see how it works.
This is the output when we select the percentile function:
When we look at the table we see that 2016 has been assigned a value of 67% for accessories . This means that in the row of accessories the sales value for 2016 is more than 67% of the values for accessories ( Accessories has 4 values and 67% would mean 3 ie the sales in year 2016 is ranked 2 as the only percentile value above it is 100% for year 2017)
4- Moving Average
A moving average (MA) is a trend-following or lagging indicator because it is based on past values . Often we come across situations where we are required to plot moving averages . Lets try to understand how a moving average is calculated from our table .
As before clear the applied table calculation. Right click on sales and then select moving averages under quick table calculations. Our values in the view would change to :

Let us try to understand what happened when we selected moving averages. Th value for year 2014 remain the same, however the value for year 2015 has changed . It actually is a average of 2014 and 2015 sales . Similarly the value for 2016 is the average of 2015 and 2016. We can change the method how the moving average is calculated by going to edit table calculation . I would suggest you ti try these options and look what you get in different scenarios.
Hope you guys were able to follow through the blog. Do let me know in case if you have any issues. We will continue our discussions on quick table calculation in the next article.
Till then happy tableauing.