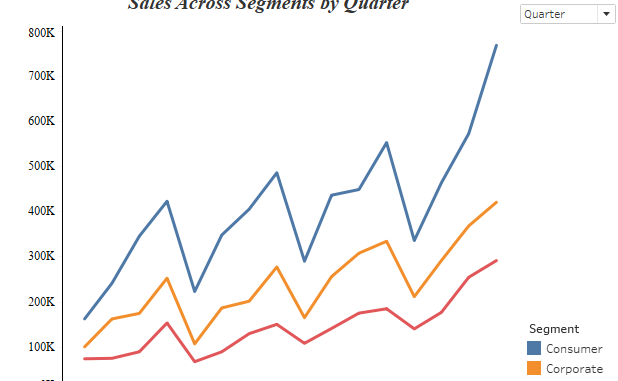
Hi Everyone out there. In today’s blog under tableau tips we will see how we can change the axis dates granularity by a date parameter. Here is the workbook that we will show you what we are trying to achieve .
Here we can see that as we change the value of the Date Parameter from Year to Month or to date , the X axis also changes.
Here are the steps to achieve it. I am using the sample super stores data.
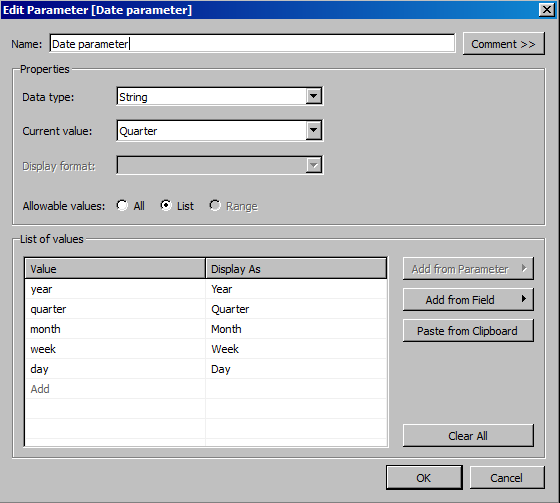
Step 1: Create a date parameter as under :
Step 2: Create a Calculated Field variable date as under :

Bring the Variable date field to Columns and from the dropdown select exact date.
Drag Sales to the Rows . Add Segment to color.
Right click on the Date parameter field and click on Show parameter control.
Toggle the parameter control option and the chart would update automatically as the date changes.
Hope you guys enjoyed the post.


