Tableau Charts : Symbol & Filled Maps
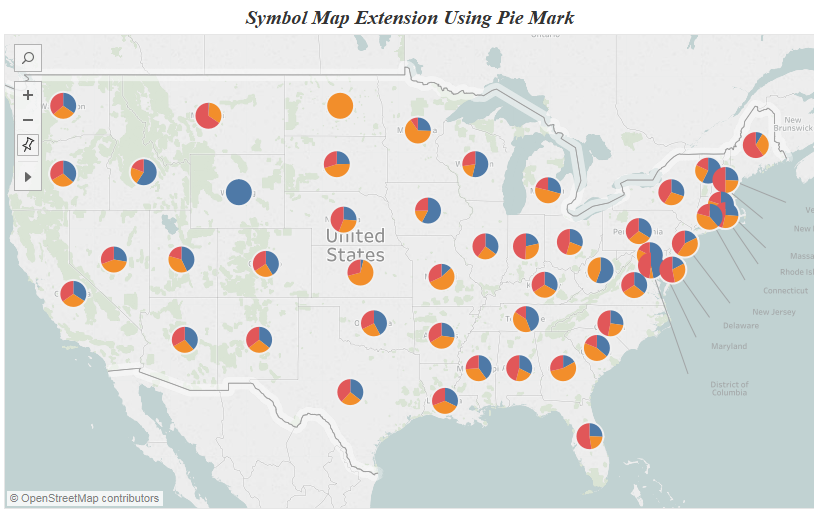
In the previous blog we looked into Heat Maps & Highlight Tables . In tableau when we are dealing with geographic variable we have two options : […]
In the previous blog we looked into Heat Maps & Highlight Tables . In tableau when we are dealing with geographic variable we have two options : […]
Copyright © 2025 | WordPress Theme by MH Themes