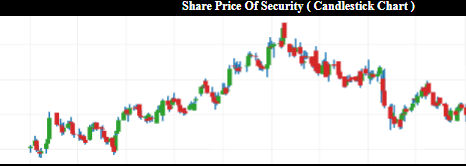
Advanced Charting : Candlestick/Stock Charts
Hi All, In this article I am going to plot a candlestick chart in tableau . A candlestick chart (also called Japanese candlestick chart) is a […]

Hi All, In this article I am going to plot a candlestick chart in tableau . A candlestick chart (also called Japanese candlestick chart) is a […]

Hi All, In the following post we will see how do we create a DNA chart , most commonly know as dumbbell charts in tableau […]
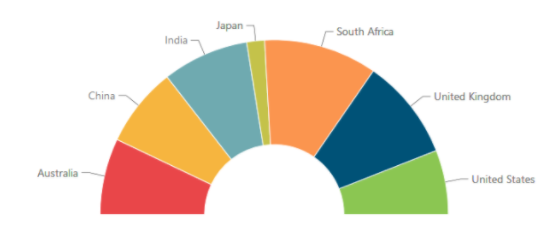
Hi All, Yesterday I came across a scenario where some one on the tableau community has asked about creating this kind on chart in tableau […]
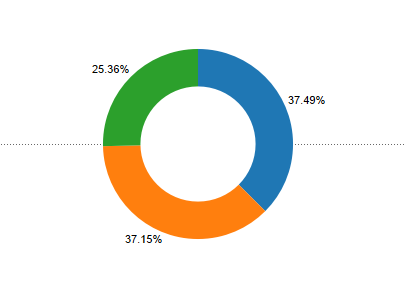
Hi All, In this blog I would talk about creating Donut chart in tableau step by step , Step 1: Import the excel file in […]

Hi All, In this blog I would like to focus on how we can use countd to create calculated field that can answer our requirements. […]
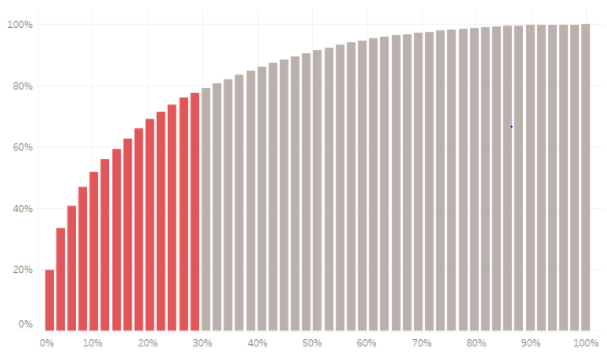
Hi All, In this blog I will be writing about how to build pareto charts in Tableau. A Pareto chart, also called a Pareto distribution […]

Hi All, Today I am going to talk about a scenario in which I had an encounter with dates in Tableau. The objective was to […]
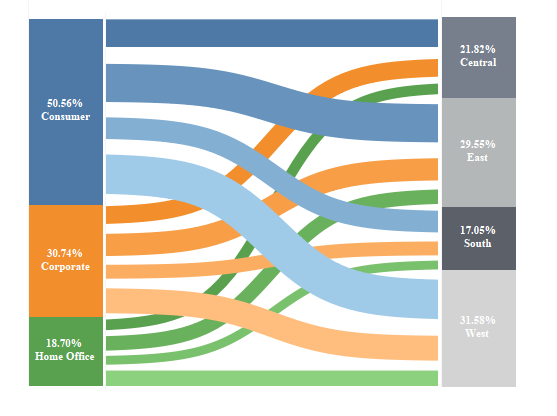
Hi All, In this blog post I will guide you through how to create a Sankey Diagram. Sankey diagrams are a specific type of flow diagram, […]

Hi All, In this blog I would show you how to get the top three sub categories under each Category. For this we would use […]
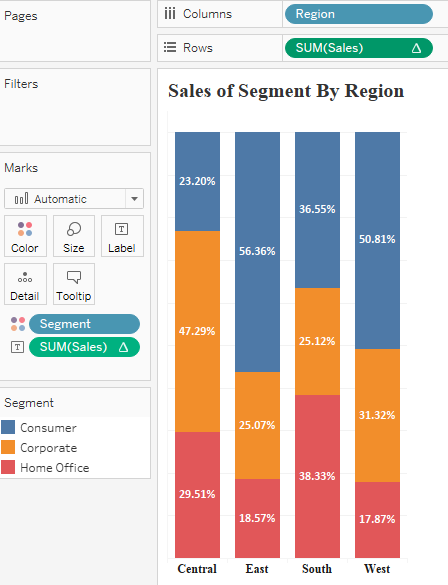
Hello Everyone out there. This is the first in series of my blog post “Visualising data in Tableau from Scratch”. In the subsequent blog following this […]
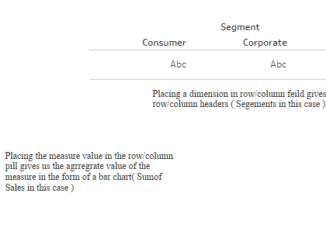
The article guides us through the most basic concept in Tableau – Measures Dimensions and how to differentiate between the two. Whenever we import/connect a […]
Copyright © 2025 | WordPress Theme by MH Themes