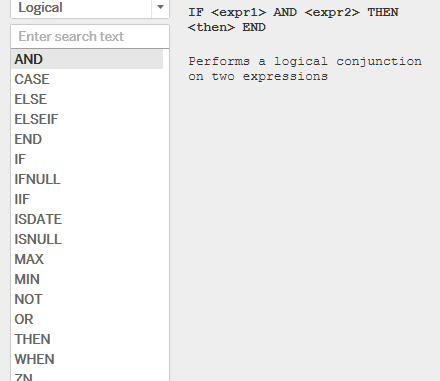
Today we will discuss about the logical functions available in Tableau.
The following are the list of Logical functions available in Tableau :
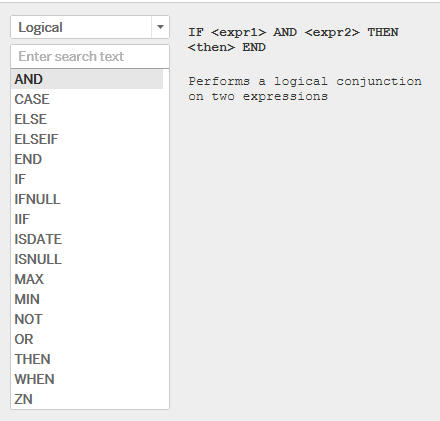
In this blog we will keep our focus on the following logical functions : CASE, IF, IFNULL , IIF , ISNULL . We will see that when we are discussing about the above mentioned function we will automatically be covering AND, END, ELSE, ELSEIF, THEN and WHEN .
The remaining functions MAX, MIN, NOT and ZN we will cover when we talk about numerical functions.
1- CASE : The case function finds the value that matches a given expression and then returns the corresponding value. This function can be used to recode a pre-existing variable. For example lets say we want to recode our Categories Furniture , Office Supplies and Technology as Category 1, Category 2 and Category 3 respectively. In this case we would use the case expression as follows:

When we place the Category field and our newly created field in the Rows we see that our Categories have now been renamed to a custom value.
2- IF Statement: The if statement behaves in a similar fashion as it works in excel . The if function creates a logical test. The test part of the statement must be Boolean, either by using a Boolean field in the data source or as the result of an expression using operators or logical comparisons (AND, OR, NOT).
Lets try to categorize the sales of subcategories into High , Medium and Low values using the IF Statement. Create a calculated field Sales Category as under:
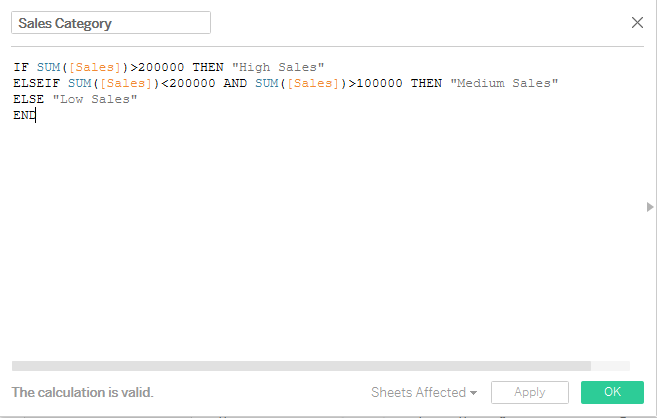
The if statement categorizes the sub categories by the sales values . Sub Categories with sales more than 200000 are “High Selling Sub Categories” , between 100000 and 200000 are “Medium Selling Sub Categories” and the rest are “Low Selling”
To see our newly calculated field in action Drag Sales Category and Sub Category to the rows. Place sales on the text mark and Sales Category in the color mark. Your worksheet will now be somewhat like this:

We see that the subcategories are now under the three heads that we created using their sales values. Also coloring the sales by these field makes us easy to identify them. Alternatively we can use this newly calculated field to color the sales bar as well as shown below. To do this simply drag sub category to the Columns and Sales to rows. Now add the calculated field Sales Category to the colors mark.

Here the green bars represent the Sub Categories with High Sales, Blue represents Medium Sales and Red represent least sales.
3- ISNULL: This function simply tests whether an expression is null (TRUE) or not (FALSE).
for example ISNULL([Sub-Category]) will give the value true if there is null in subcategory else false . This can be further used in the filter to select only the Sub Categories with non null value.
4- IFNULL: The iffnull function is used to assign a value to a missing value in a field .
For example the statement IFNULL([sales],0) would replace the sales value by 0 if there is any null in the Sales in our database.
5- IFF: The IIF function is very similar to the IF function above. It essentially creates a shorthand function for an IF-THEN-ELSE statement. The IIF function checks whether a condition is met , and returns one value if true, another value if false, and a optional third value NULL if unknown.
Lets try to use the IFF statement to find the subcategories that are selling above average and the one below average . We will be using a windows function here to calculate the average sales (Window_Avg) . Do not worry if you do not know about this , we will discuss more about it in our section of Table Calculations.
Create a calculated field as under :
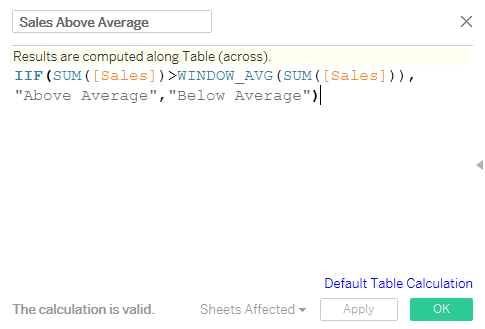
Now drag Sub Category into Columns and Sales into Rows. Select the marks as bars and place the created field Sales Above Average in the colors mark . Your view will now be the following :
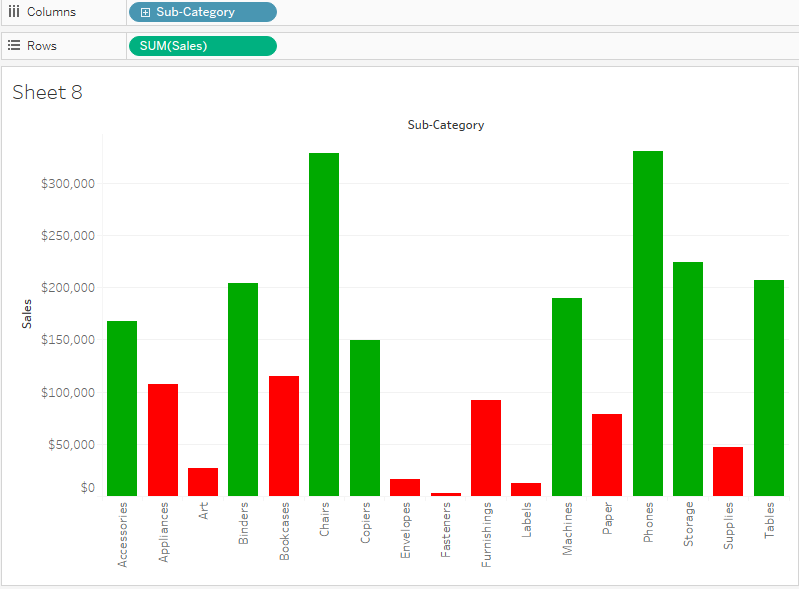
Here the green bars represent the Sub Categories with sales above average and the red one below average.
Hope you all found this post interesting . In the next post of logical functions we will discuss the remaining logical functions. Until then happy tableauing .
