Data Vizzes

Data Vizzes

Turning Data Into Insights

  • Home
  • Tableau Tutorial
    • Tableau Basics
    • Tableau Charts
    • Tableau Calculations
    • Tableau Tips
    • Tableau Advanced Charts
    • Video Tutorials
  • Statistics
    • Introduction
    • #5MinuteStats
  • Learning R
  • Open Data Journalism
  • My Portfolio
  • Interactive Me

Articles by Rahul

Measures Of Dispersion

February 3, 2020 Rahul 0

Here is a 5 minute video about the different measures of dispersion.

Measures Of Central Tendency

January 28, 2020 Rahul 0

This short video gives a brief introduction about the most common measures of central tendency : Mean, Median and Mode

Introduction To Statistics

January 26, 2020 Rahul 0

Here is a five minute video on Introduction to Stats and the two broad classification of statistics.

Tableau Dashboard Tips : Do’s and Don’ts

January 26, 2020 Rahul 2

There is no denying fact that we all love to create new dashboards in tableau. Why not it’s a fun activity. We put on extreme […]

A Different Approach to Represent Percent Values : Tableau Rings

January 15, 2020 Rahul 0

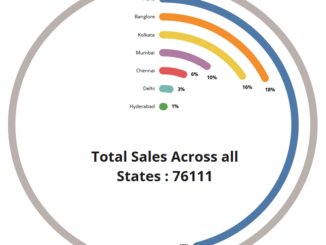
In this blog I will walk-through the steps of creating Tableau Rings. For the Makeover Monday Challenge ( those who do not know about the […]

Circular Calendar Charts in Tableau

January 12, 2020 Rahul 0

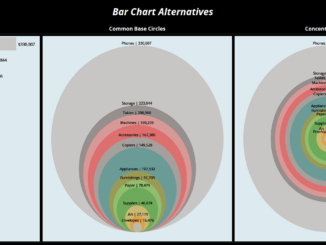
Hoping that you guys enjoyed the previous blogs regarding Visualizing Time series and Circles with common base. Continuing to our posts on Circles , here […]

Circles With Common Base: An alternative to bars

January 10, 2020 Rahul 1

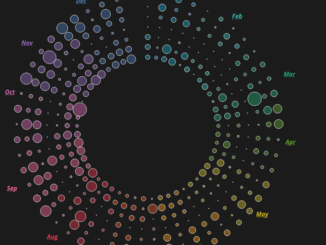
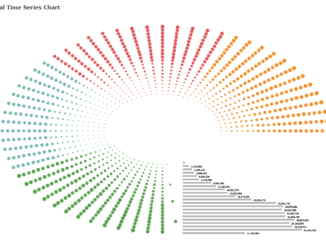
Hi every one. In the earlier blog we discussed about how to represent a time series data on a radial chart. This post is also […]

Visualizing Radial Time Series Data To Uncover Patterns in Tableau

January 5, 2020 Rahul 2

First of all A Happy New Year and decade to all those who are reading this. Last year was quite  a busy one and I […]

Extracting Benefits of the Duo: Tableau and R – Part 2

October 29, 2018 Rahul 0

Connect Tableau with R – Get Beauty with Power Tableau, as we all know, is the go-to tool for visualization, today. R is an open-source […]

Analytics Pane: Uncover the inherent patterns in your data by clustering using Tableau

September 12, 2018 Rahul 0

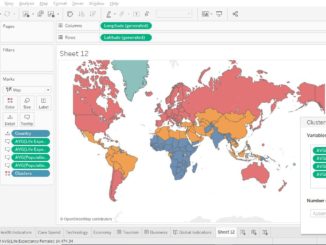
Clustering is grouping similar observations or data points of similar measures. Clustering helps our daily businesses in many ways. Let’s see an example, there are […]

Tableau Dashboard Tips: Do’s and don’ts for designing efficient Tableau dashboard

September 12, 2018 Rahul 0

Dashboard to its user is what an assistant is his boss. While an assistant helps in managing multiple tasks for his boss, dashboard helps in […]

Tableau Dashboard Tips: Auto update filters when the data refreshed daily

September 12, 2018 Rahul 0

Hi All, This post is the first in the series where I will be discussing with tips and trick to enhance your tableau dashboard and […]

Posts pagination

« 1 2 3 4 … 10 »

Please follow & like us :)

YouTube
YouTube
fb-share-icon
LinkedIn
LinkedIn
Share
Twitter
Visit Us
Follow Me
Post on X
Telegram
RSS

Subscribe to our mailing list

Loading

Categories

Recent Posts

  • Designing all device-compatible Tableau dashboards
  • Publish a Workbook : Tableau
  • Dynamic Reference Bands : Set Actions
  • Vizzing Data Connect Episode 1
  • Tableau Tip : Show/Hide Containers
May 2025
S M T W T F S
 123
45678910
11121314151617
18192021222324
25262728293031
« Aug    

Archives


Tags

calculation (1) charts (1) Circular Calendar (1) Comparing Dates (1) Concentric Circles Tableau (1) Dashboard (1) date functions (1) Group (1) Indian Statistics (2) LOD (1) Makeover Monday (4) News Makeover (1) Onion Ring Charts (1) Packed Circles (1) Parameter Actions (10) Radial Charts (2) Radial Chart Tableau (1) Set Actions (1) Sets (1) slope charts (1) Statistics (4) Tableau (4) Tableau Advanced Charts (14) Tableau Basics (5) Tableau Calculations (4) Tableau Charts (12) Tableau Rings (1) Tableau Spirals (1) Tableau Tips (8) Table Calculations (2) Uncategorized (2) Vizzing Random Data (3)

Categories

May 2025
S M T W T F S
 123
45678910
11121314151617
18192021222324
25262728293031
« Aug    

Recent Posts

  • Designing all device-compatible Tableau dashboards
  • Publish a Workbook : Tableau
  • Dynamic Reference Bands : Set Actions
  • Vizzing Data Connect Episode 1
  • Tableau Tip : Show/Hide Containers

Previous Posts

Contact Us

  • Email
    rahul@vizzingdata.com
  • Phone
    9912616315
  • Address
    Hyderabad

Copyright © 2025 | WordPress Theme by MH Themes

error

Enjoy this blog? Please spread the word :)

  • YouTube
    YouTube
  • fb-share-icon
  • LinkedIn
    LinkedIn
    Share
  • Twitter
    Visit Us
    Follow Me
    Post on X
  • Telegram
  • RSS