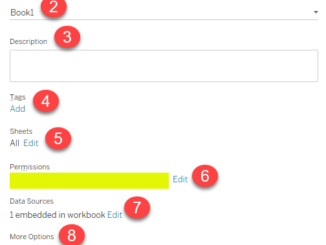
Publish a Workbook : Tableau
A very happy new year to all of you out there. I hope the last year was great for you all and this year brings […]

A very happy new year to all of you out there. I hope the last year was great for you all and this year brings […]
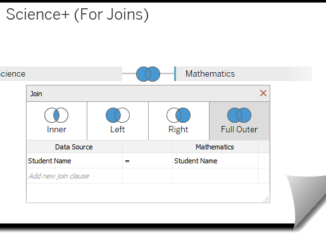
The data we analyze mostly does not reside in on single table. Instead the information that we are looking for may be present in other […]
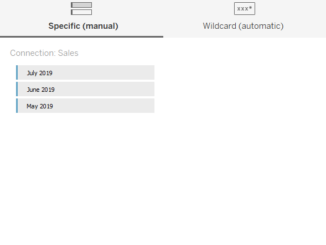
In this blogpsot we will understand how to union our data in Tableau. My earlier posts were about parameter actions and we learned how to […]
There is no denying fact that we all love to create new dashboards in tableau. Why not it’s a fun activity. We put on extreme […]
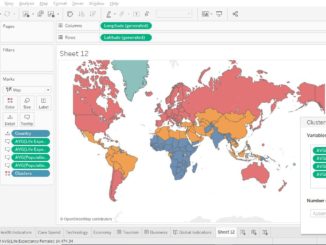
Clustering is grouping similar observations or data points of similar measures. Clustering helps our daily businesses in many ways. Let’s see an example, there are […]

Extracting Benefits of the Duo: Tableau and R Tableau is one of the best business intelligence tools available in the market at present. It has […]
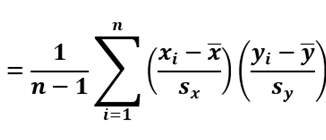
What is correlation? Correlation is a statistical measure that indicates the extent to which two or more variables are related. The measure of correlation between […]
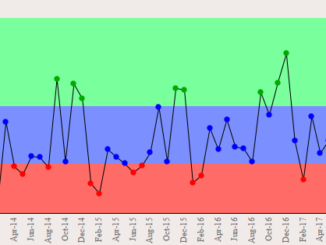
In the last article under Analytics Pane we discusses about Cluster Analysis in Tableau. Today we will see another option available under the Analytics Pane […]
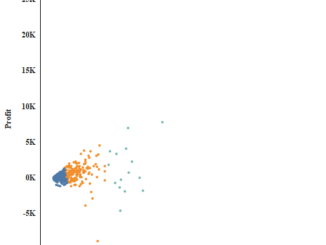
Today in this article under Analytics pane we will discuss about Cluster Analysis. Clustering is a powerful new feature in Tableau 10 that allows you to […]
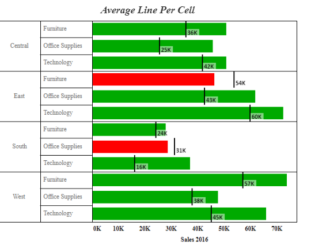
In the previous article under this series we learnt about average lines for entire table and per pane . Today we will continue our discussion […]
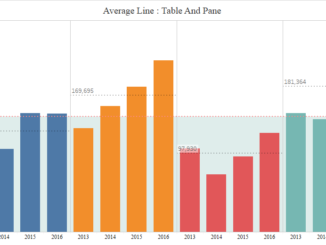
In the previous post under Analytics Pane we discussed about the constant line and its use. Today we are going to continue our discussion with […]
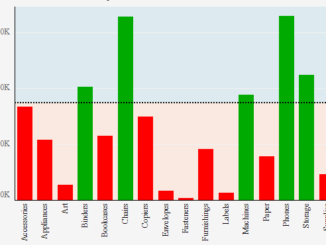
In this series of blog we will try to understand the options available under the Analytics Pane in tableau ( Constant Line, Average Line , […]
Copyright © 2025 | WordPress Theme by MH Themes