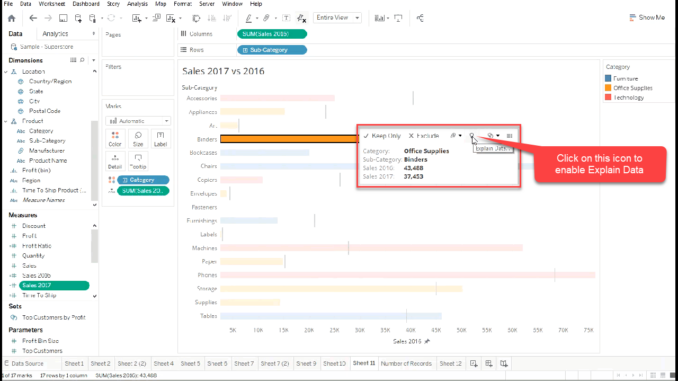
Explain data is a powerful feature that’s come into tableau which lets you deep dive into your data. You can use it inspect , uncover and dig deep into a mark in your viz as you try to analyse your data. When you select the mark and run Explain data , tableau builds statistical model internally and tries to propose possible explanation for the value of the mark selected. It can also utilize the information from other fields in your data which would not be present in your viz.
Explain data can be used on Tableau Desktop ( public as well as professional ) , Tableau online and Tableau server . The data must be from a single data source , explain data does not work with blended data sources.
Steps to use explain data :
Step 1 : Create you viz
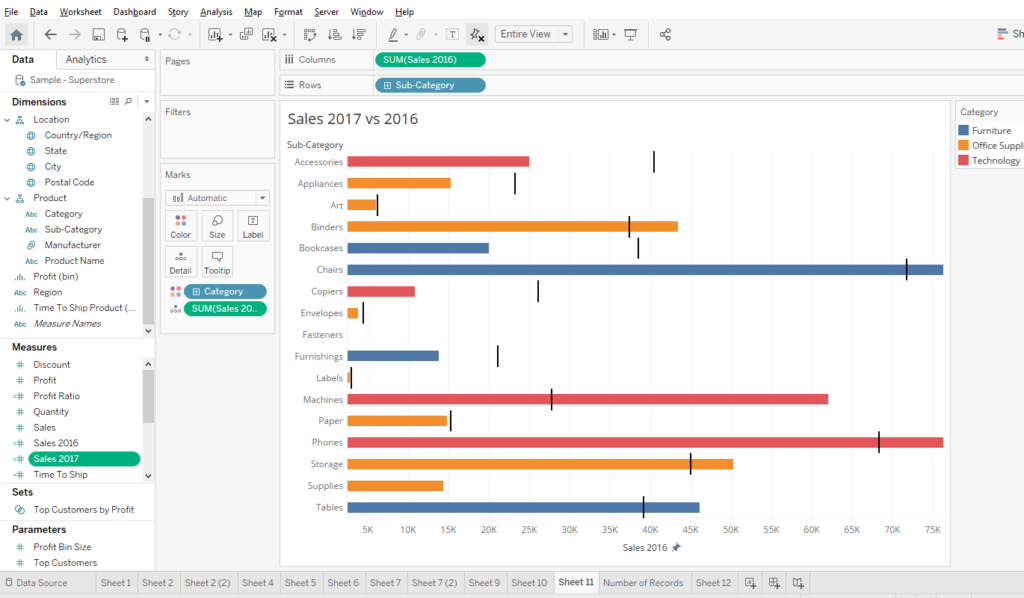
Lets built a sample viz that compares the sales in 2017 to the sales of 2016 across sub categories from our sample super store data.
Here are the calculated field for Sales 2016 and 2017


Once you have created both the measures select them and the click on the bullet chart from the show me space. Once done drag sub-categories to the rows and categories to the column . Your view will now be as under:
Step 2 : Using the explain data feature
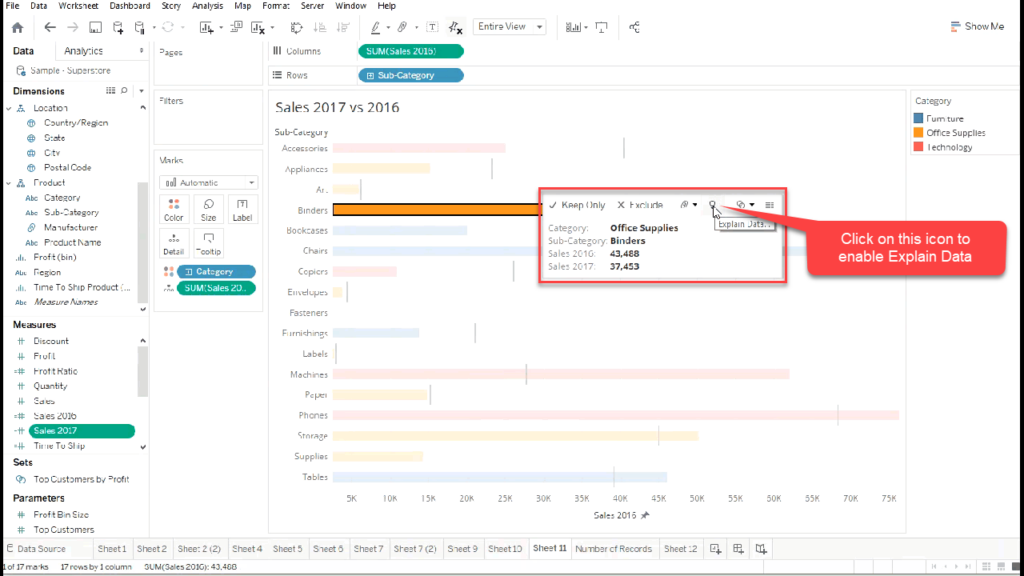
Click on any bar that you would like to deep dive into. Once you select a bar you will see a small bulb like icon beside the set icon . Select that icon to enable explain data. Once you select the icon , tableau will analyze that particular mark and will give you the analysis about that mark.
Here is the analysis that I got after clicking on the explain data for the selected mark.

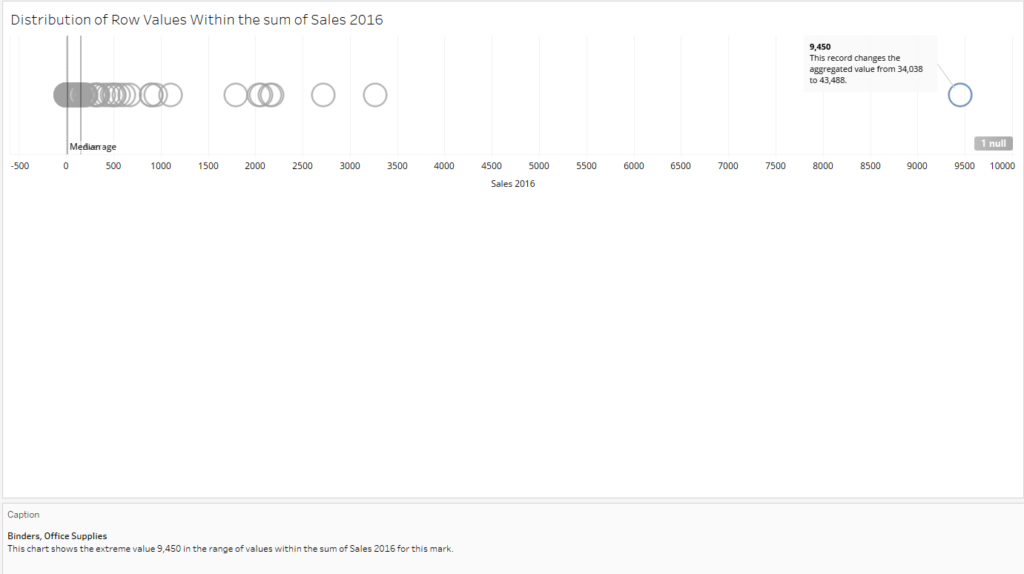
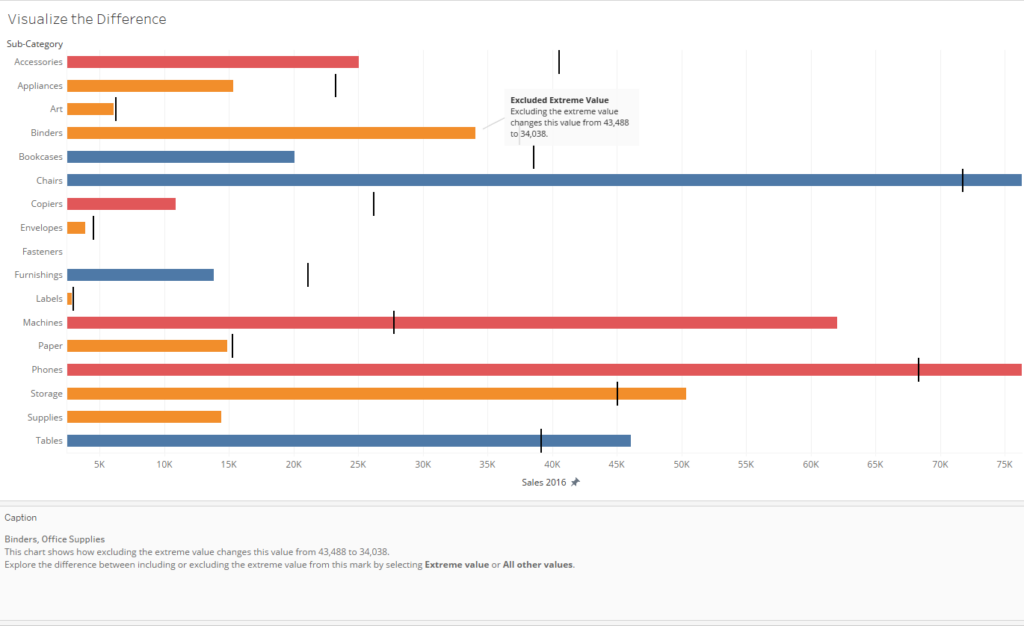
These three charts that came up with the Explain data help us to gain more insights in the mark that we selected. For example it tells us that here is a outlier in the mark that we have selected and removing that outlier would change the mark value considerably. There are other insights as well that you can gain from these analysis based upon your understanding of the data.
Hope you guys enjoyed this post about the new feature in Tableau and would now use this feature to deep dive into your data set more.
Happy Learning!!
