
Hi All,
In the earlier post in this series we talked about Bar Chart and Variants . In this post and the following we will discuss about Text Tables, Heat Maps and Highlight tables in tableau. These three are the first three charts options that we get when we click on the show me tab.
Lets find out about them taking each of them individually.
Text Tables : To create a text table we need at-least one measure and one dimension. To find out more about measure and dimension refer here : Measures & Dimension. A text table is commonly also referred to as a Crosstab. It gives us a view like we would get if we look the data in excel. The mark type is text and the data is organised in Rows and Columns. Let us create a text table now using the sample super store data. To do that drag the Category and Sub Category dimension in the Rows pill and year on the Column Pill . Place the measure that you would like to see on the text mark . Your text table is now ready. This is what a text table looks like.
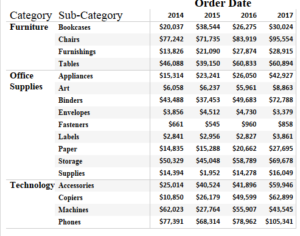
The only condition for creating a text table is that you should not have any continuous field either in the Rows or Columns . Text tables in their plane form are not very desirable as they do not provide much insight and are not recommend as a primary visualization. The same table can be spiced up a bit to get more insights . If we place the profit measure in the colors mark this is what we get :
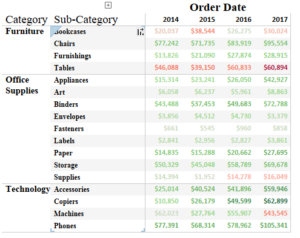
Now just by looking at the table we can see that the Profits for Tables is negative across all the years. The addition of Profit to the colors mark added a whole new aspect to our story.
In the upcoming blog in this series we will have a hands on with Heat Maps and Highlight tables.
Until then keep tableauing and keep learning.
Thanks.
Rahul Singh