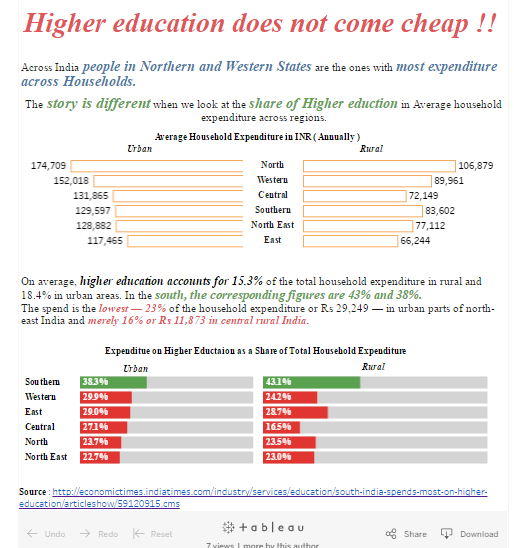
Share of Higher Education In Household Expenditure
Hi All, This is the first in series of my News Makeover in which I would be building vizzess based on news articles that I […]

Hi All, This is the first in series of my News Makeover in which I would be building vizzess based on news articles that I […]
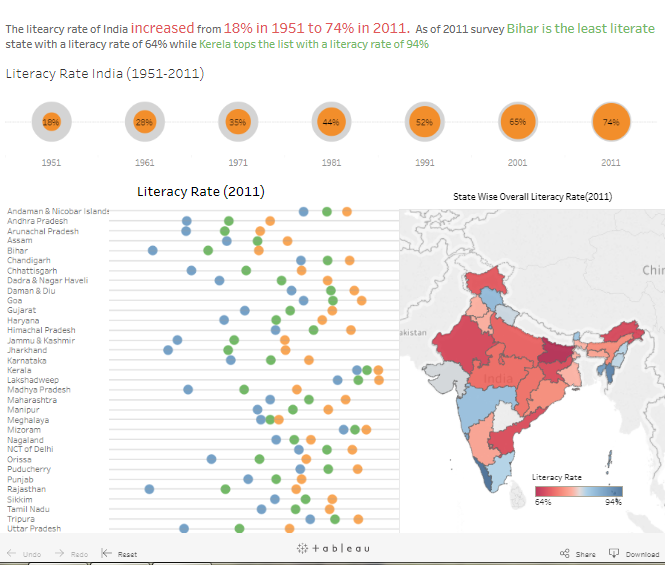
Literacy rate in India increased from a mere 18% in 1951 to 74% as of 2011. As of 2011 Bihar was the least literate state […]
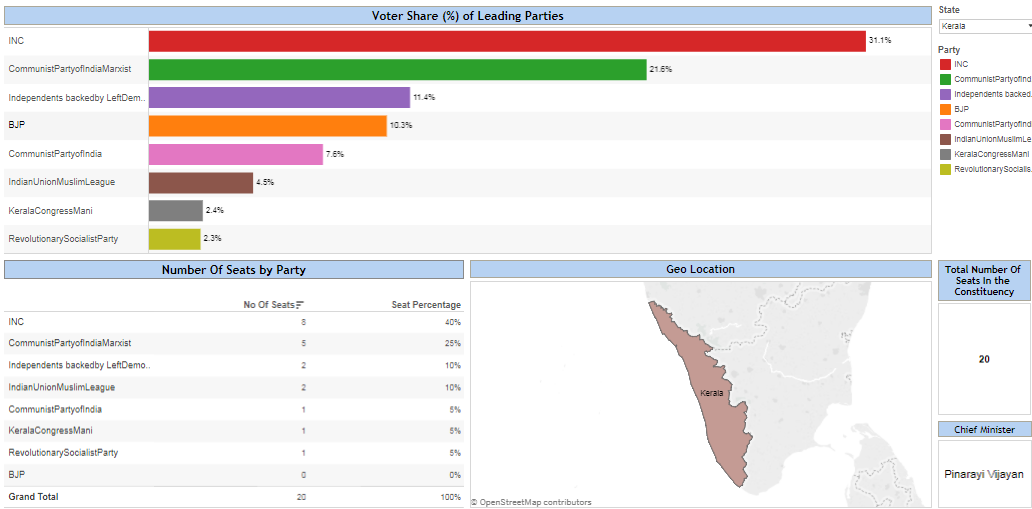
Members of the 16th Lok Sabha were elected during the 2014 Indian general election. The elections were conducted in 9 phases from 7 April 2014 […]
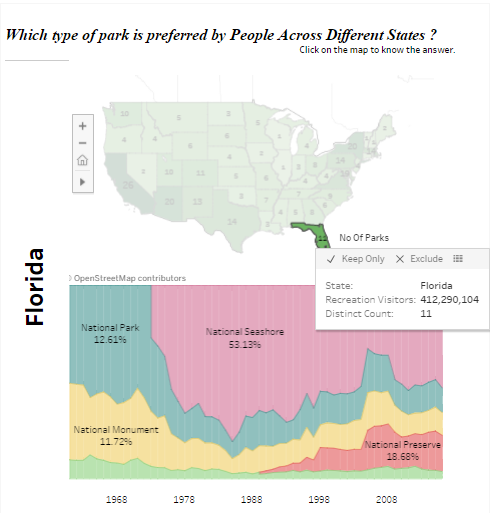
In this blog I have tried to visualize the data which had information about Number of Recreational Visitors in Parks across US States. The following […]
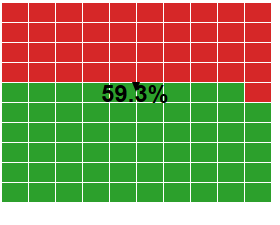
Hi All, In this blog I am going to take you step by step to create a waffle chart. A waffle chart is the best […]
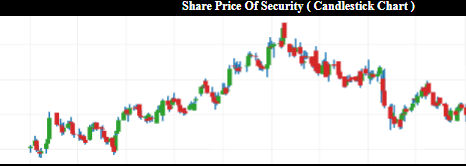
Hi All, In this article I am going to plot a candlestick chart in tableau . A candlestick chart (also called Japanese candlestick chart) is a […]

Hi All, In the following post we will see how do we create a DNA chart , most commonly know as dumbbell charts in tableau […]
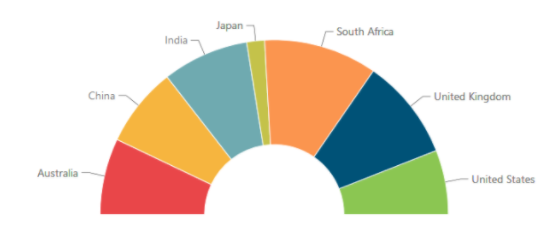
Hi All, Yesterday I came across a scenario where some one on the tableau community has asked about creating this kind on chart in tableau […]
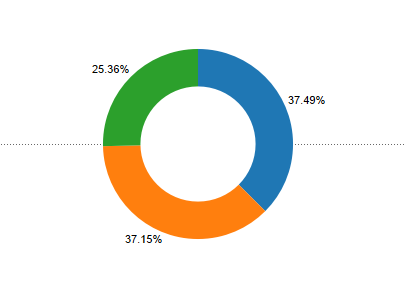
Hi All, In this blog I would talk about creating Donut chart in tableau step by step , Step 1: Import the excel file in […]

Hi All, In this blog I would like to focus on how we can use countd to create calculated field that can answer our requirements. […]
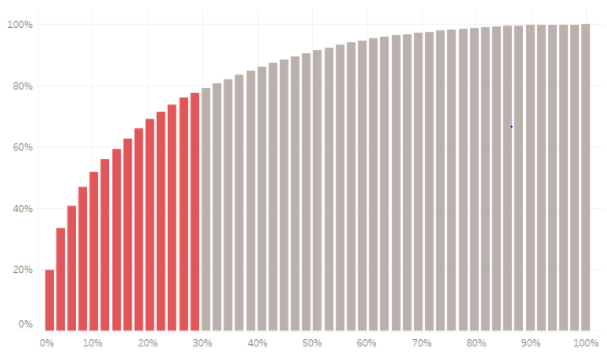
Hi All, In this blog I will be writing about how to build pareto charts in Tableau. A Pareto chart, also called a Pareto distribution […]

Hi All, Today I am going to talk about a scenario in which I had an encounter with dates in Tableau. The objective was to […]
Copyright © 2025 | WordPress Theme by MH Themes