Data Vizzes

Data Vizzes

Turning Data Into Insights

  • Home
  • Tableau Tutorial
    • Tableau Basics
    • Tableau Charts
    • Tableau Calculations
    • Tableau Tips
    • Tableau Advanced Charts
    • Video Tutorials
  • Statistics
    • Introduction
    • #5MinuteStats
  • Learning R
  • Open Data Journalism
  • My Portfolio
  • Interactive Me

Tableau Tutorial

Tableau Tips: Using Parameters as common filter for two data sources

January 16, 2018 Rahul 0

Hi All, First of all a happy new to all of you and may this new year bring on a lot of learning for you. […]

Tableau Tips: Conditional Formatting On Multiple Measures

November 29, 2017 Rahul 3

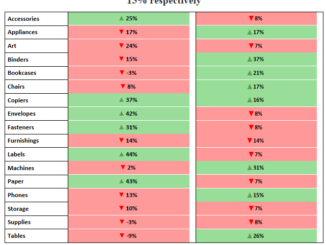
In this blog under tableau tip we are going to discuss about applying conditional formatting to individual measures . Remember how in the last article […]

Tableau Tips: Conditional Formatting

November 23, 2017 Rahul 4

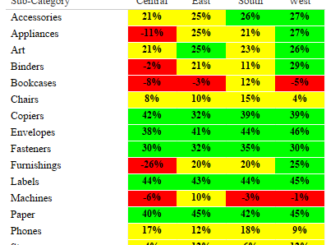
Hi All, In this article under tableau tips we would see how to do conditional formatting in Tableau the similar way we do in excel. […]

Tableau Tips : Comparing Sales with previous Business Day

November 4, 2017 Rahul 0

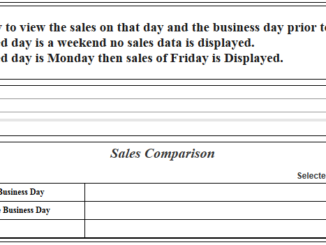
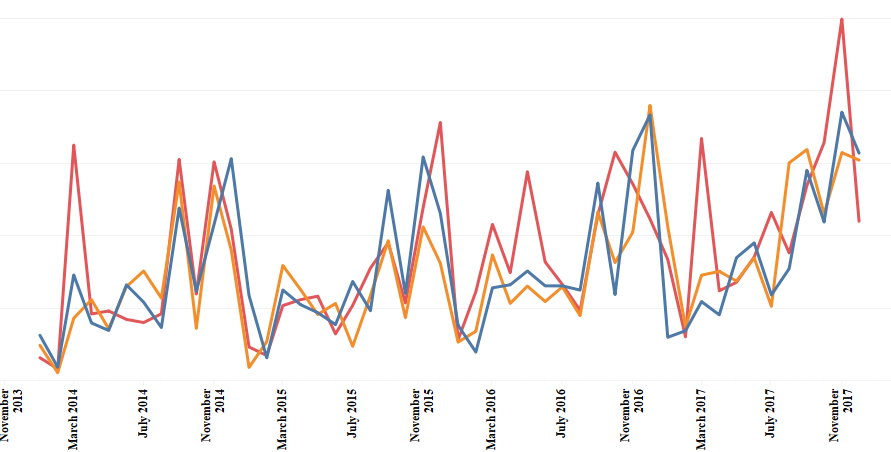
In today’s tableau tip we are going to see how do we compare the sales of a custom selected date with the previous business day […]

Advanced Charting : Fitting a Bell Curve To Our Data

October 31, 2017 Rahul 0

In the last article of advanced charts we discussed about how to create a scatter pie plot in tableau. Today we will discuss an interesting […]

Tableau Tips : Sorting By Measure

October 25, 2017 Rahul 0

In the last article under tableau tips we learnt how to give user the choice to select sort order. Today we will discuss yet another […]

Tableau Tips : Selecting Sort Order

October 24, 2017 Rahul 0

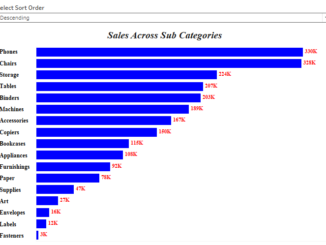
In Today’s Tableau tip we will see how to give user control for Selecting Sort Order of a given chart. Lets say that we have […]

Tableau Tips: Highlight Data Point In a Custom Date Range

October 21, 2017 Rahul 0

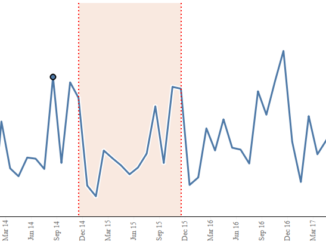
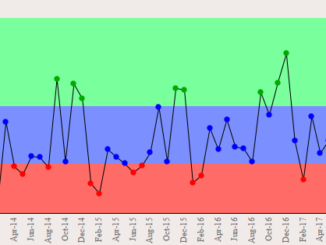
In this article under Tableau Tips we will see how to highlight the data that is between two dates. Let us suppose we have the […]

Analytics Pane Part 5: Reference Bands

October 21, 2017 Rahul 0

In the last article under Analytics Pane we discusses about Cluster Analysis in Tableau. Today we will see another option available under the Analytics Pane […]

Analytics Pane Part 4: Cluster Analysis

October 18, 2017 Rahul 0

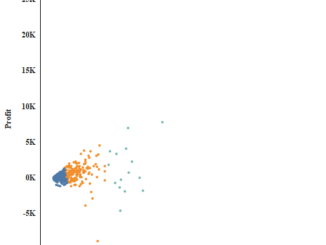
Today in this article under Analytics pane we will discuss about Cluster Analysis. Clustering is a powerful new feature in Tableau 10 that allows you to […]

Analytics Pane Part 3: Average Line Per Cell

September 28, 2017 Rahul 0

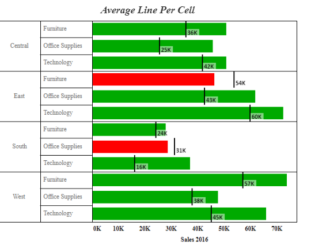
In the previous article under this series we learnt about average lines for entire table and per pane . Today we will continue our discussion […]

Analytics Pane Part 2 : Average Line

September 28, 2017 Rahul 0

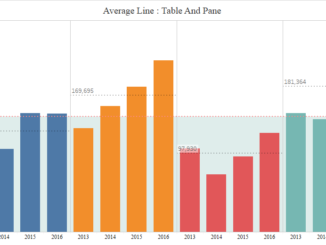
In the previous post under Analytics Pane we discussed about the constant line and its use. Today we are going to continue our discussion with […]

Posts pagination

« 1 … 3 4 5 … 9 »

Please follow & like us :)

YouTube
YouTube
fb-share-icon
LinkedIn
LinkedIn
Share
Twitter
Visit Us
Follow Me
Post on X
Telegram
RSS

Subscribe to our mailing list

Loading

Categories

Recent Posts

  • Designing all device-compatible Tableau dashboards
  • Publish a Workbook : Tableau
  • Dynamic Reference Bands : Set Actions
  • Vizzing Data Connect Episode 1
  • Tableau Tip : Show/Hide Containers
May 2025
S M T W T F S
 123
45678910
11121314151617
18192021222324
25262728293031
« Aug    

Archives


Tags

calculation (1) charts (1) Circular Calendar (1) Comparing Dates (1) Concentric Circles Tableau (1) Dashboard (1) date functions (1) Group (1) Indian Statistics (2) LOD (1) Makeover Monday (4) News Makeover (1) Onion Ring Charts (1) Packed Circles (1) Parameter Actions (10) Radial Charts (2) Radial Chart Tableau (1) Set Actions (1) Sets (1) slope charts (1) Statistics (4) Tableau (4) Tableau Advanced Charts (14) Tableau Basics (5) Tableau Calculations (4) Tableau Charts (12) Tableau Rings (1) Tableau Spirals (1) Tableau Tips (8) Table Calculations (2) Uncategorized (2) Vizzing Random Data (3)

Categories

May 2025
S M T W T F S
 123
45678910
11121314151617
18192021222324
25262728293031
« Aug    

Recent Posts

  • Designing all device-compatible Tableau dashboards
  • Publish a Workbook : Tableau
  • Dynamic Reference Bands : Set Actions
  • Vizzing Data Connect Episode 1
  • Tableau Tip : Show/Hide Containers

Previous Posts

Contact Us

  • Email
    rahul@vizzingdata.com
  • Phone
    9912616315
  • Address
    Hyderabad

Copyright © 2025 | WordPress Theme by MH Themes

error

Enjoy this blog? Please spread the word :)

  • YouTube
    YouTube
  • fb-share-icon
  • LinkedIn
    LinkedIn
    Share
  • Twitter
    Visit Us
    Follow Me
    Post on X
  • Telegram
  • RSS