Data Vizzes

Data Vizzes

Turning Data Into Insights

  • Home
  • Tableau Tutorial
    • Tableau Basics
    • Tableau Charts
    • Tableau Calculations
    • Tableau Tips
    • Tableau Advanced Charts
    • Video Tutorials
  • Statistics
    • Introduction
    • #5MinuteStats
  • Learning R
  • Open Data Journalism
  • My Portfolio
  • Interactive Me

Month: September 2017

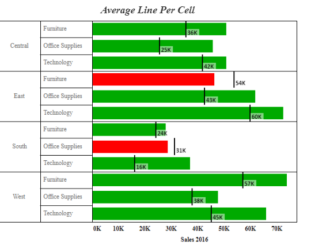
Analytics Pane Part 3: Average Line Per Cell

September 28, 2017 Rahul 0

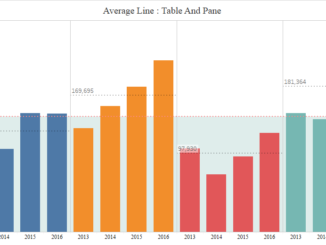
In the previous article under this series we learnt about average lines for entire table and per pane . Today we will continue our discussion […]

Analytics Pane Part 2 : Average Line

September 28, 2017 Rahul 0

In the previous post under Analytics Pane we discussed about the constant line and its use. Today we are going to continue our discussion with […]

Analytics Pane Part 1 : Constant Line

September 28, 2017 Rahul 0

In this series of blog we will try to understand the options available under the Analytics Pane in tableau ( Constant Line, Average Line , […]

Advanced Charting : Scatter Pie Chart in Tableau

September 25, 2017 Rahul 0

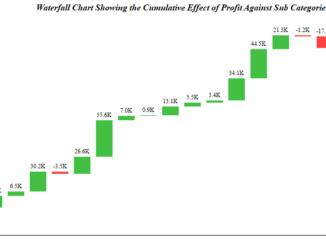
The previous article in the series highlighted the steps to create a waterfall chart in Tableau. Today we will discuss about a interesting chart in […]

Advanced Charting : Waterfall Charts in Tableau

September 25, 2017 Rahul 0

In the last article under Advanced Charting we discussed how to create Rank Charts in Tableau . Today we will discuss about how to make […]

Tableau Tips : Comparing Sales For Current Date, Month Before And Year Before

September 22, 2017 Rahul 0

Many times we come across situations when we have to compare values for different time period. With reference to our Sample Superstore data lets say […]

Understanding Date Functions In Tableau : Part 2

September 22, 2017 Rahul 0

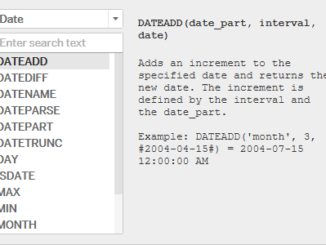
In the previous article we looked into the first four date function. To day we will continue our discussion on  the other date functions available […]

Advanced Charting : Rank Charts in Tableau

September 15, 2017 Rahul 1

In this article we will see how to construct a rank/bump chart in Tableau. A rank chart is an effective way to see how the […]

Advanced Charting : Slope Graphs

September 14, 2017 Rahul 0

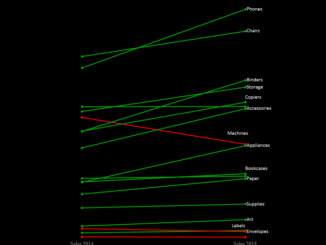
In this blog of advance charting we are going to discuss about how to build slope charts in Tableau. A slope chart is used when […]

Understanding Date Functions in Tableau : Part 1

September 14, 2017 Rahul 0

In the previous post we discussed about Logical functions in Tableau . Today we will go ahead with the date functions available in Tableau. To […]

Tableau Tips : Displaying Top And Bottom in the same worksheet

September 3, 2017 Rahul 1

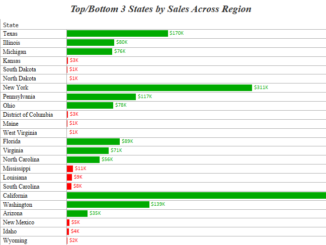
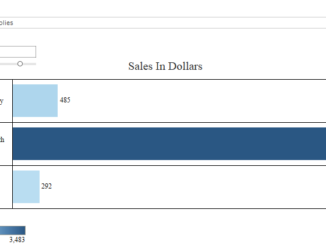
Hi All, Today I am going to discuss about the Top/Bottom Option that tableau provides us with to filter the dimension. Whenever we try to […]

Tableau Tips : Area Chart With Two Colours

September 1, 2017 Rahul 2

Hi Everybody out there. In todays tip I will show you an effective way of creating an area chart with two colours . Lets go […]

Please follow & like us :)

YouTube
YouTube
fb-share-icon
LinkedIn
LinkedIn
Share
Twitter
Visit Us
Follow Me
Post on X
Telegram
RSS

Subscribe to our mailing list

Loading

Categories

Recent Posts

  • Designing all device-compatible Tableau dashboards
  • Publish a Workbook : Tableau
  • Dynamic Reference Bands : Set Actions
  • Vizzing Data Connect Episode 1
  • Tableau Tip : Show/Hide Containers
September 2017
S M T W T F S
 12
3456789
10111213141516
17181920212223
24252627282930
« Aug   Oct »

Archives


Tags

calculation (1) charts (1) Circular Calendar (1) Comparing Dates (1) Concentric Circles Tableau (1) Dashboard (1) date functions (1) Group (1) Indian Statistics (2) LOD (1) Makeover Monday (4) News Makeover (1) Onion Ring Charts (1) Packed Circles (1) Parameter Actions (10) Radial Charts (2) Radial Chart Tableau (1) Set Actions (1) Sets (1) slope charts (1) Statistics (4) Tableau (4) Tableau Advanced Charts (14) Tableau Basics (5) Tableau Calculations (4) Tableau Charts (12) Tableau Rings (1) Tableau Spirals (1) Tableau Tips (8) Table Calculations (2) Uncategorized (2) Vizzing Random Data (3)

Categories

September 2017
S M T W T F S
 12
3456789
10111213141516
17181920212223
24252627282930
« Aug   Oct »

Recent Posts

  • Designing all device-compatible Tableau dashboards
  • Publish a Workbook : Tableau
  • Dynamic Reference Bands : Set Actions
  • Vizzing Data Connect Episode 1
  • Tableau Tip : Show/Hide Containers

Previous Posts

Contact Us

  • Email
    rahul@vizzingdata.com
  • Phone
    9912616315
  • Address
    Hyderabad

Copyright © 2025 | WordPress Theme by MH Themes

error

Enjoy this blog? Please spread the word :)

  • YouTube
    YouTube
  • fb-share-icon
  • LinkedIn
    LinkedIn
    Share
  • Twitter
    Visit Us
    Follow Me
    Post on X
  • Telegram
  • RSS