Data Vizzes

Data Vizzes

Turning Data Into Insights

  • Home
  • Tableau Tutorial
    • Tableau Basics
    • Tableau Charts
    • Tableau Calculations
    • Tableau Tips
    • Tableau Advanced Charts
    • Video Tutorials
  • Statistics
    • Introduction
    • #5MinuteStats
  • Learning R
  • Open Data Journalism
  • My Portfolio
  • Interactive Me

Tableau Advanced Charts

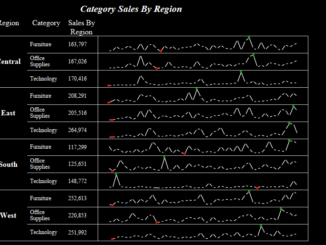
Advanced Charting : Sparklines In Tableau

August 25, 2017 Rahul 0

A sparkline is a very small line chart, typically drawn without axes or coordinates. It presents the general shape of the variation (typically over time) […]

Advanced Charting: Arrow Charts In tableau

July 25, 2017 Rahul 0

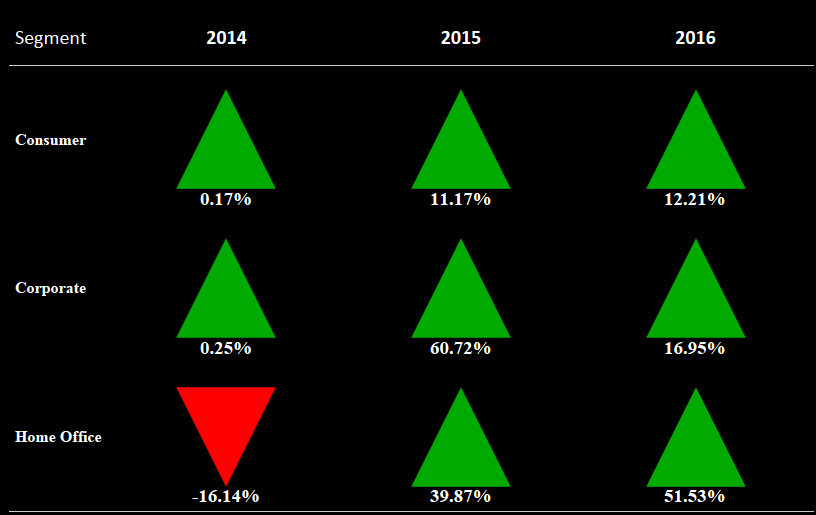
Hi All, In this blog of Advanced charting series I am going to talk about how to build a Up Down arrow chart in tableau. […]

Advanced Charting : Quadrant Charts

July 21, 2017 Rahul 2

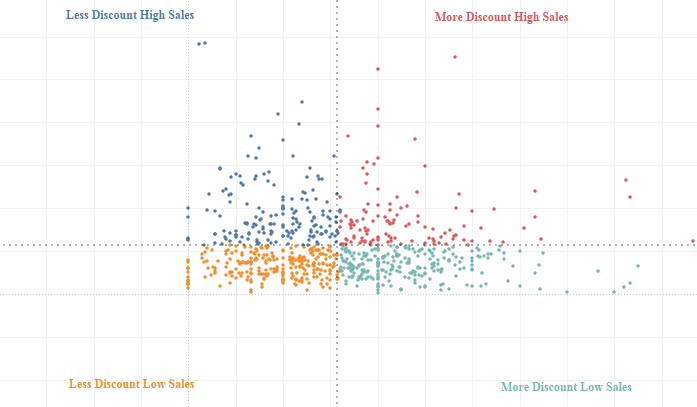
Hi All, In this blog of Advanced charting series we will take a look into how to build a quadrant chart in tableau . A […]

Advanced Charting : Diverging bar / Funnel Charts

July 18, 2017 Rahul 0

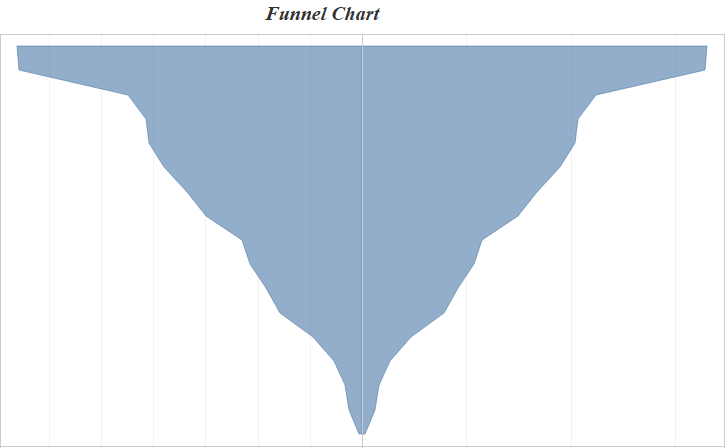
Hi All, In this blog of Advanced Charting using tableau we will see how to build a funnel chart / diverging bar chart in tableau. […]

Advanced Charting : Bar Under Bar

July 12, 2017 Rahul 0

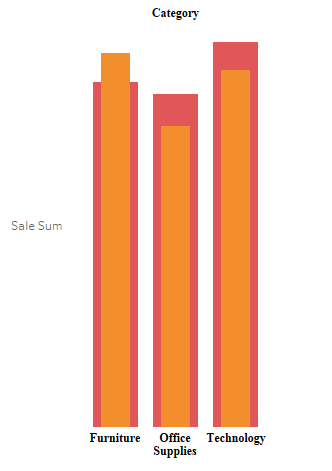
Hi All, In today blog I will write about how we can create a bar chart within a bar chart . This is how a […]

Advanced Charting : Waffle Charts

July 9, 2017 Rahul 0

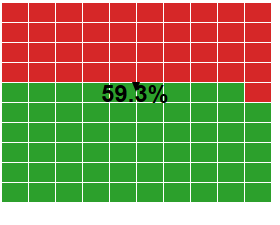
Hi All, In this blog I am going to take you step by step to create a waffle chart. A waffle chart is the best […]

Advanced Charting : Candlestick/Stock Charts

July 9, 2017 Rahul 0

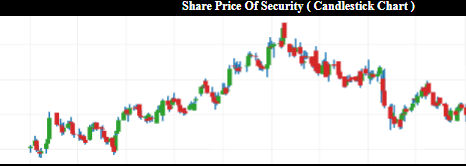
Hi All, In this article I am going to plot a candlestick chart in tableau . A candlestick chart (also called Japanese candlestick chart) is a […]

Advanced Charting : DNA Charts

July 9, 2017 Rahul 0

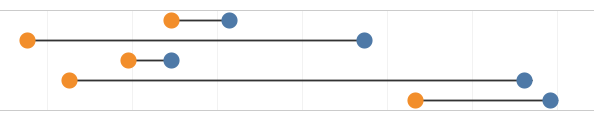
Hi All, In the following post we will see how do we create a DNA chart , most commonly know as dumbbell charts in tableau […]

Advanced Charting : Semi Donut Chart

July 9, 2017 Rahul 1

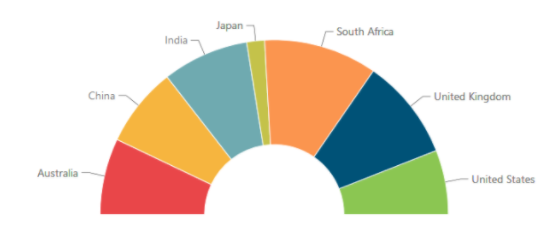
Hi All, Yesterday I came across a scenario where some one on the tableau community has asked about creating this  kind on chart in tableau […]

Advanced Charting : Donut Chart

July 9, 2017 Rahul 0

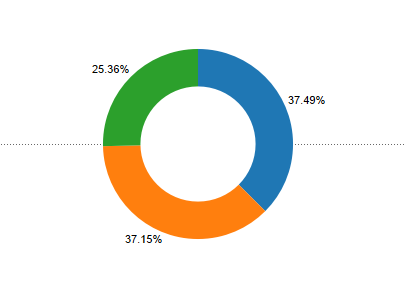
Hi All, In this blog I would talk about creating Donut chart in tableau step by step , Step 1: Import the excel file in […]

Advance Charting : Pareto Charts

July 9, 2017 Rahul 0

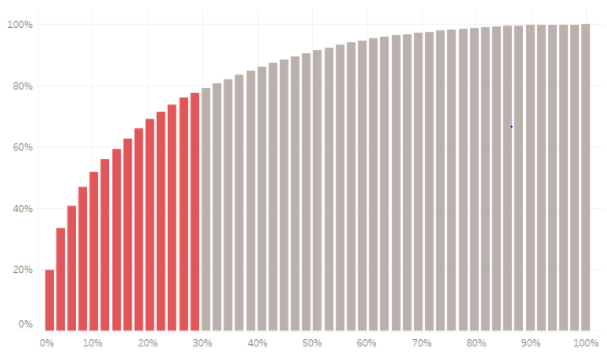
Hi All, In this blog I will be writing about how to build pareto charts in Tableau. A Pareto chart, also called a Pareto distribution […]

Advance Charting : Sankey Diagrams

July 9, 2017 Rahul 1

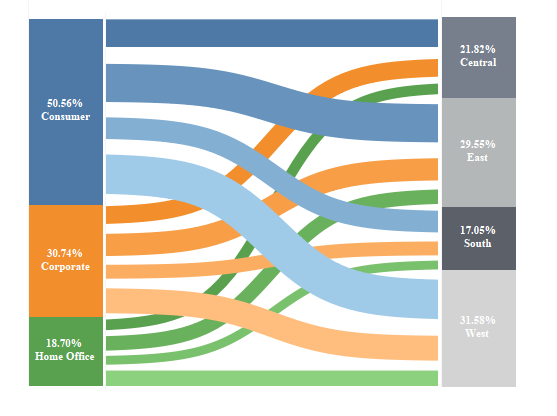
Hi All, In this blog post I will guide you through how to create a Sankey Diagram. Sankey diagrams are a specific type of flow diagram, […]

Posts pagination

« 1 2

Please follow & like us :)

YouTube
YouTube
fb-share-icon
LinkedIn
LinkedIn
Share
Twitter
Visit Us
Follow Me
Post on X
Telegram
RSS

Subscribe to our mailing list

Loading

Categories

Recent Posts

  • Designing all device-compatible Tableau dashboards
  • Publish a Workbook : Tableau
  • Dynamic Reference Bands : Set Actions
  • Vizzing Data Connect Episode 1
  • Tableau Tip : Show/Hide Containers
May 2025
S M T W T F S
 123
45678910
11121314151617
18192021222324
25262728293031
« Aug    

Archives


Tags

calculation (1) charts (1) Circular Calendar (1) Comparing Dates (1) Concentric Circles Tableau (1) Dashboard (1) date functions (1) Group (1) Indian Statistics (2) LOD (1) Makeover Monday (4) News Makeover (1) Onion Ring Charts (1) Packed Circles (1) Parameter Actions (10) Radial Charts (2) Radial Chart Tableau (1) Set Actions (1) Sets (1) slope charts (1) Statistics (4) Tableau (4) Tableau Advanced Charts (14) Tableau Basics (5) Tableau Calculations (4) Tableau Charts (12) Tableau Rings (1) Tableau Spirals (1) Tableau Tips (8) Table Calculations (2) Uncategorized (2) Vizzing Random Data (3)

Categories

May 2025
S M T W T F S
 123
45678910
11121314151617
18192021222324
25262728293031
« Aug    

Recent Posts

  • Designing all device-compatible Tableau dashboards
  • Publish a Workbook : Tableau
  • Dynamic Reference Bands : Set Actions
  • Vizzing Data Connect Episode 1
  • Tableau Tip : Show/Hide Containers

Previous Posts

Contact Us

  • Email
    rahul@vizzingdata.com
  • Phone
    9912616315
  • Address
    Hyderabad

Copyright © 2025 | WordPress Theme by MH Themes

error

Enjoy this blog? Please spread the word :)

  • YouTube
    YouTube
  • fb-share-icon
  • LinkedIn
    LinkedIn
    Share
  • Twitter
    Visit Us
    Follow Me
    Post on X
  • Telegram
  • RSS