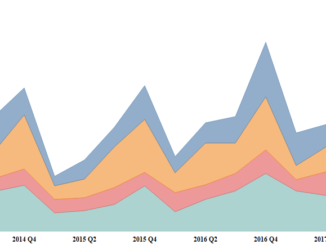
Tableau Charts: Discrete and Continuous Area Charts
In the previous blog of this series we discussed about Line Charts . Today we will discuss about Area charts. Area charts are constructed in the similar […]

In the previous blog of this series we discussed about Line Charts . Today we will discuss about Area charts. Area charts are constructed in the similar […]
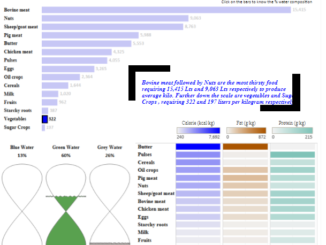
This week makeover Monday was about the water footprints in our food. Everyone knows what carbon footprint is , but do we know what is […]
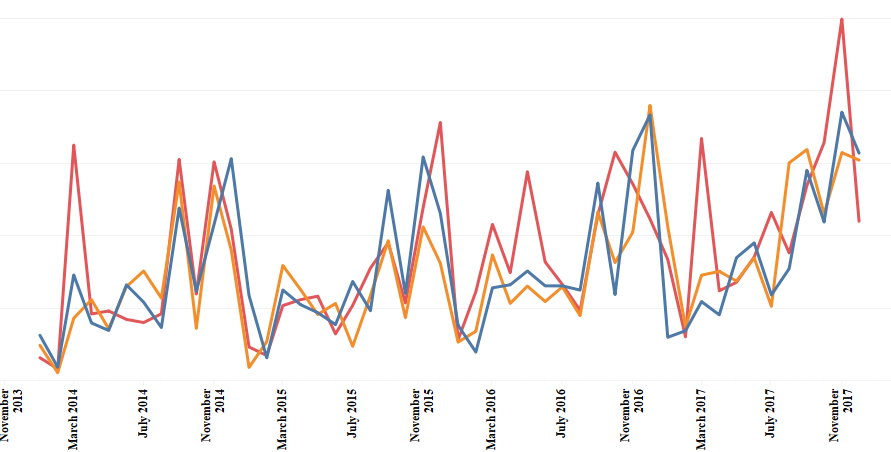
Hi All, In the previous blog of the series Tableau Charts we discussed about Treemaps . Today we will be discussing about one of the most basic […]
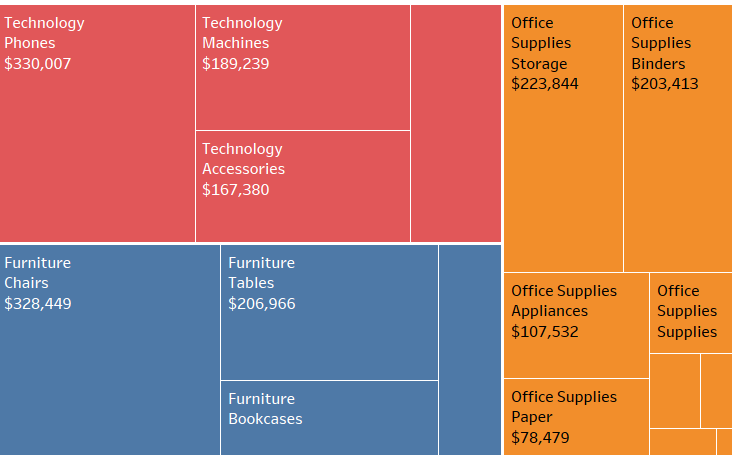
Hi All, In this blog of the ongoing series on Tableau Charts we will talk about Treemaps. A treemap is a diagram representing hierarchical data in […]
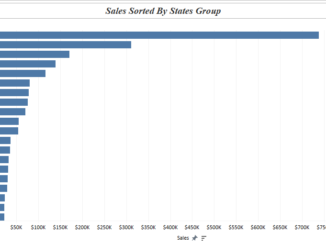
Hi All, In this blog I am going to discuss the concepts of Sets and Groups in Tableau . Both of these seems to be […]
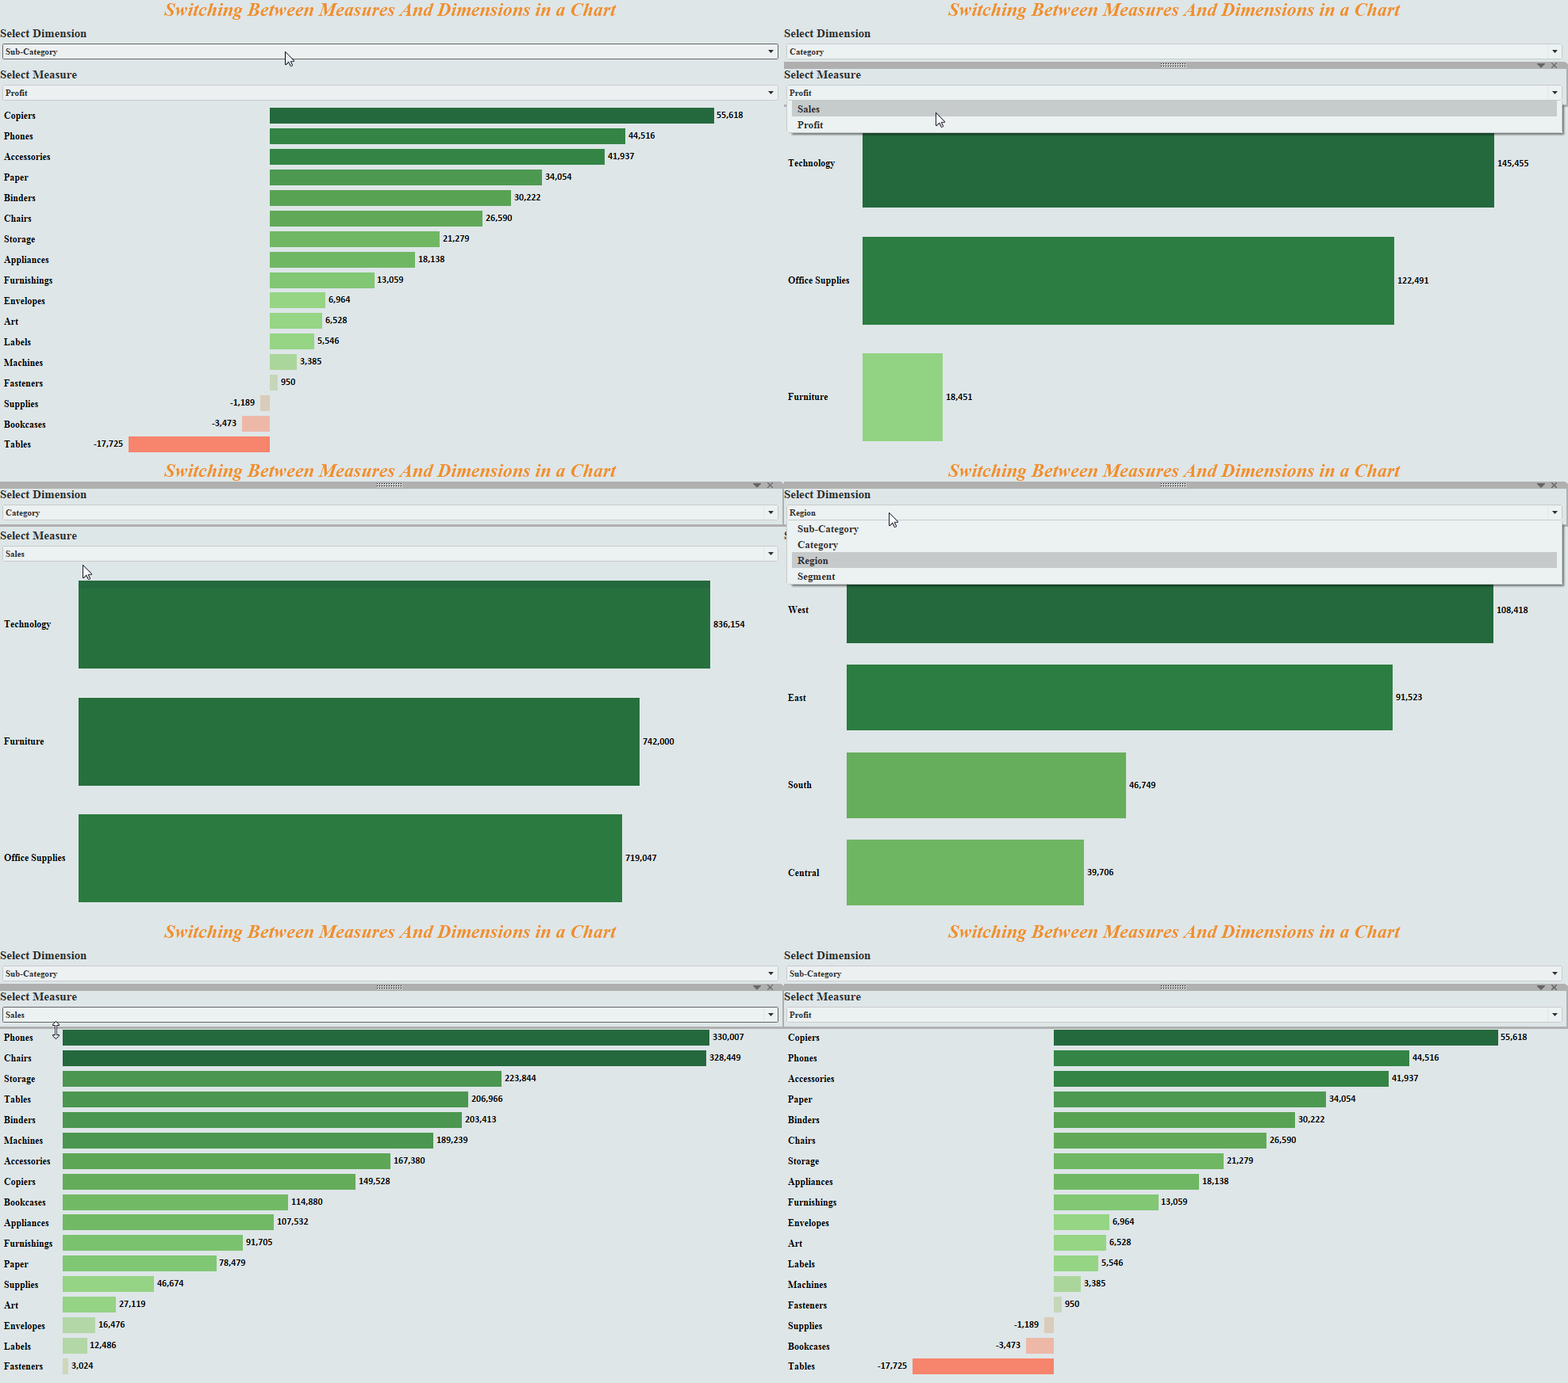
Hi All, In today’s tableau tip I will show you an effective way of changing the measures and dimensions in a chart using parameter. Consider […]
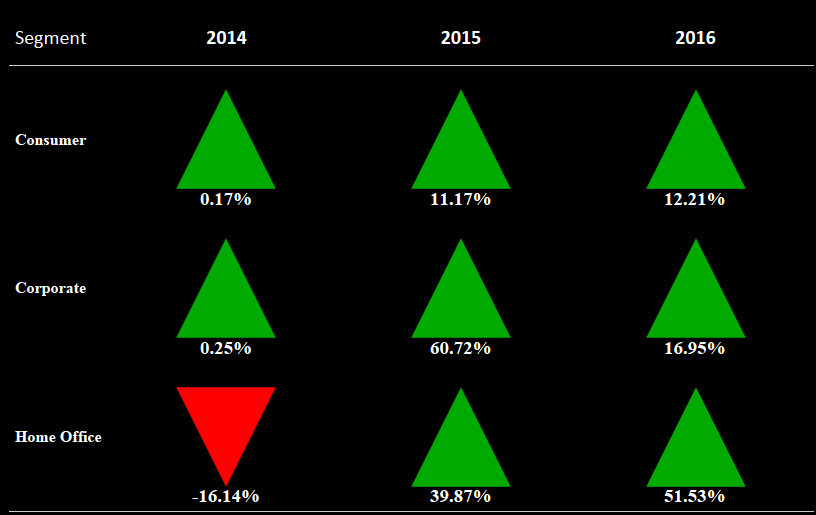
Hi All, In this blog of Advanced charting series I am going to talk about how to build a Up Down arrow chart in tableau. […]
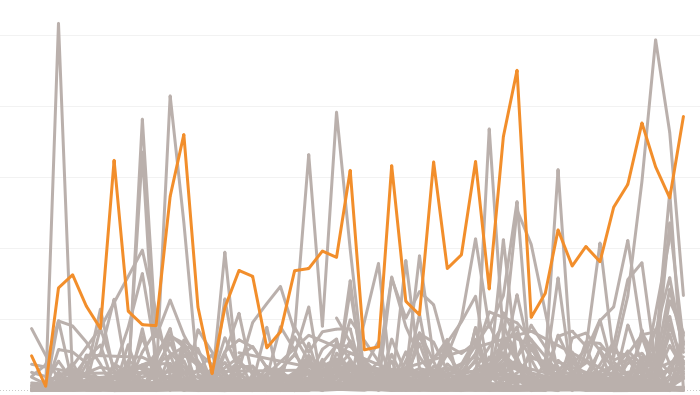
Hi All, In today’s tableau tip we will discuss how to highlight a selected value when selected in the filter dropdown. Let us go ahead […]

Hi All, In this blog of Advanced charting series we will take a look into how to build a quadrant chart in tableau . A […]
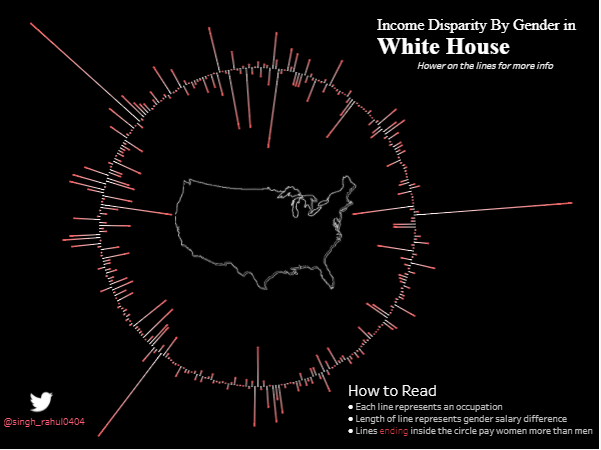
This visualization tells us about the Pay Gap between male and females for the same position in White house. Lines which are inside the circle […]
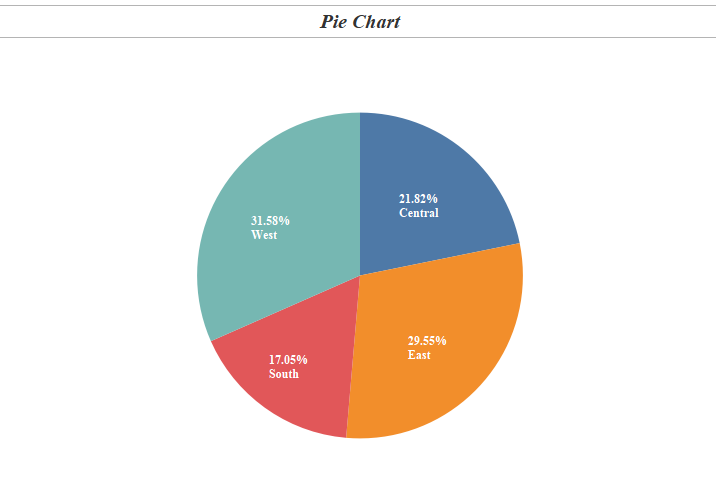
In the last blog in the series Tableau Charts we talked about Symbols & Filled Maps . Today we will talk about a most common chart type […]
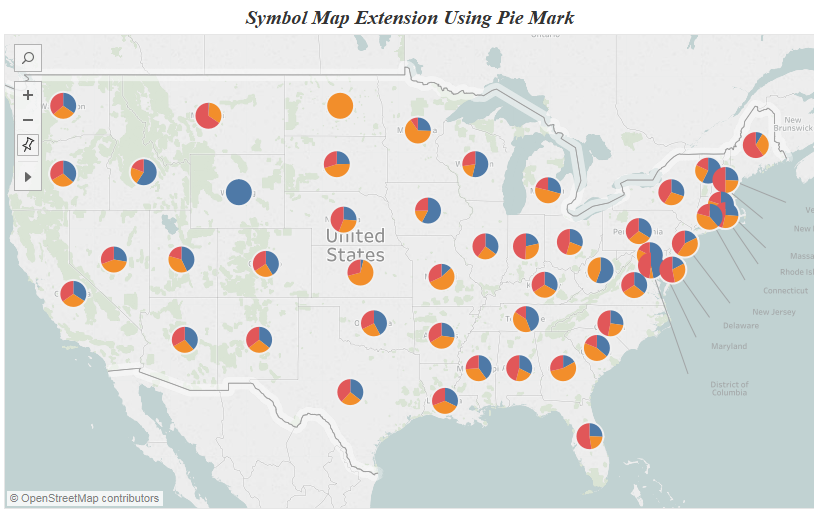
In the previous blog we looked into Heat Maps & Highlight Tables . In tableau when we are dealing with geographic variable we have two options : […]
Copyright © 2025 | WordPress Theme by MH Themes