Data Vizzes

Data Vizzes

Turning Data Into Insights

  • Home
  • Tableau Tutorial
    • Tableau Basics
    • Tableau Charts
    • Tableau Calculations
    • Tableau Tips
    • Tableau Advanced Charts
    • Video Tutorials
  • Statistics
    • Introduction
    • #5MinuteStats
  • Learning R
  • Open Data Journalism
  • My Portfolio
  • Interactive Me

Tableau Tutorial

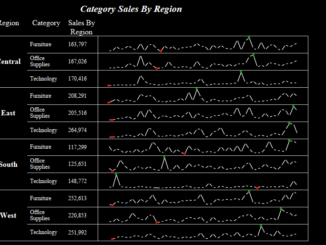
Advanced Charting : Sparklines In Tableau

August 25, 2017 Rahul 0

A sparkline is a very small line chart, typically drawn without axes or coordinates. It presents the general shape of the variation (typically over time) […]

Tableau Tips : Highlighting Max and Min in the Chart

August 23, 2017 Rahul 0

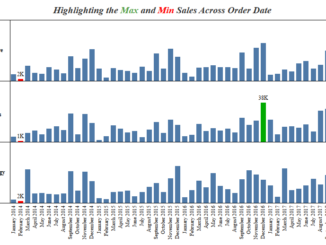
Hi All, In this blog of Tableau tips I will discuss how to highlight the top and bottom in a chart . Often we come […]

Tableau Basics : Data Types In Tableau Calculations

August 22, 2017 Rahul 0

Tableau supports string, date/datetime, number, and Boolean data types. These data types are automatically handled in the respective fashion. The data types supported by Tableau […]

Tableau Calculations : Quick Table Calculation (Part 3)

August 15, 2017 Rahul 1

Hi All, Continuing to our discussion on Quick table calculation, today we will discuss about the remaining four calculations : 1- YTD Total 2-YTD Growth […]

Tableau Tips : Stacked Bar With Connected Lines

August 10, 2017 Rahul 0

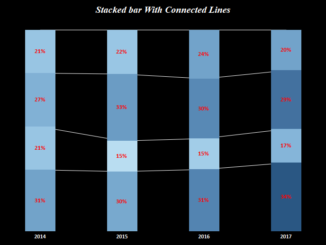
Today we will discuss about how to construct a stacked bar with connected lines in Tableau . To set the context this is what we […]

Understanding LOD Calculations in Tableau

August 9, 2017 Rahul 0

Hi All, Today in this blog I will try to explain about LOD calculations  in Tableau and discuss a couple of scenarios where a LOD […]

Tableau Calculations : Quick Table Calculation (Part 2)

August 6, 2017 Rahul 0

In the previous article under this series we discussed about Running Total , Difference and Percentage Difference. We are going to continue of discussion on […]

Tableau Charts : Packed Bubbles

August 5, 2017 Rahul 0

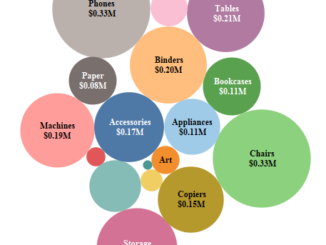
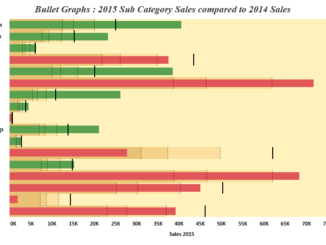
In the previous blog we discussed about Bullet Graphs. In this blog under the series Tableau Charts we will talk about Packed Bubbles . Packed […]

Tableau Charts : Bullet Graphs

August 5, 2017 Rahul 0

Hi everyone out there . Hope you guys are learning from the posts and are having a hands on practice in tableau side by side. […]

Tableau Charts : Box And Whisker Plots

August 5, 2017 Rahul 1

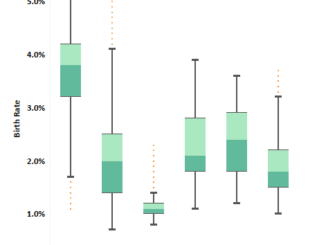
In the previous article we discussed about how to build and interpret a Histogram in Tableau . Today we will be discussing about how to build up […]

Tableau Charts : Histogram

August 3, 2017 Rahul 1

Hi All, In the previous blog under Tableau Charts we discussed about creating a dual axis charts . Today we will discuss about Histograms in […]

Tableau Calculations: Quick Table Calculation (Part 1)

August 2, 2017 Rahul 2

Hi All, This is a new blog series for Tableau in which we will be discussing how calculations work in tableau . This post covers […]

Posts pagination

« 1 … 5 6 7 … 9 »

Please follow & like us :)

YouTube
YouTube
fb-share-icon
LinkedIn
LinkedIn
Share
Twitter
Visit Us
Follow Me
Post on X
Telegram
RSS

Subscribe to our mailing list

Loading

Categories

Recent Posts

  • Designing all device-compatible Tableau dashboards
  • Publish a Workbook : Tableau
  • Dynamic Reference Bands : Set Actions
  • Vizzing Data Connect Episode 1
  • Tableau Tip : Show/Hide Containers
May 2025
S M T W T F S
 123
45678910
11121314151617
18192021222324
25262728293031
« Aug    

Archives


Tags

calculation (1) charts (1) Circular Calendar (1) Comparing Dates (1) Concentric Circles Tableau (1) Dashboard (1) date functions (1) Group (1) Indian Statistics (2) LOD (1) Makeover Monday (4) News Makeover (1) Onion Ring Charts (1) Packed Circles (1) Parameter Actions (10) Radial Charts (2) Radial Chart Tableau (1) Set Actions (1) Sets (1) slope charts (1) Statistics (4) Tableau (4) Tableau Advanced Charts (14) Tableau Basics (5) Tableau Calculations (4) Tableau Charts (12) Tableau Rings (1) Tableau Spirals (1) Tableau Tips (8) Table Calculations (2) Uncategorized (2) Vizzing Random Data (3)

Categories

May 2025
S M T W T F S
 123
45678910
11121314151617
18192021222324
25262728293031
« Aug    

Recent Posts

  • Designing all device-compatible Tableau dashboards
  • Publish a Workbook : Tableau
  • Dynamic Reference Bands : Set Actions
  • Vizzing Data Connect Episode 1
  • Tableau Tip : Show/Hide Containers

Previous Posts

Contact Us

  • Email
    rahul@vizzingdata.com
  • Phone
    9912616315
  • Address
    Hyderabad

Copyright © 2025 | WordPress Theme by MH Themes

error

Enjoy this blog? Please spread the word :)

  • YouTube
    YouTube
  • fb-share-icon
  • LinkedIn
    LinkedIn
    Share
  • Twitter
    Visit Us
    Follow Me
    Post on X
  • Telegram
  • RSS