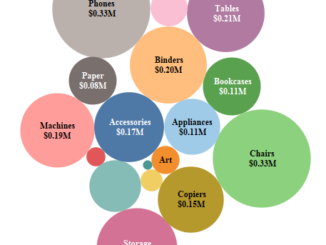
Tableau Charts : Packed Bubbles
In the previous blog we discussed about Bullet Graphs. In this blog under the series Tableau Charts we will talk about Packed Bubbles . Packed […]

In the previous blog we discussed about Bullet Graphs. In this blog under the series Tableau Charts we will talk about Packed Bubbles . Packed […]
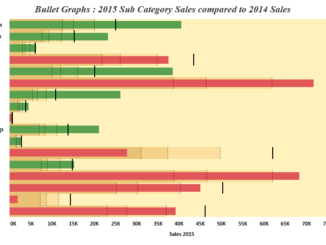
Hi everyone out there . Hope you guys are learning from the posts and are having a hands on practice in tableau side by side. […]
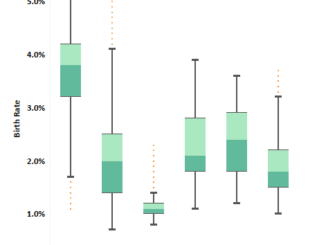
In the previous article we discussed about how to build and interpret a Histogram in Tableau . Today we will be discussing about how to build up […]
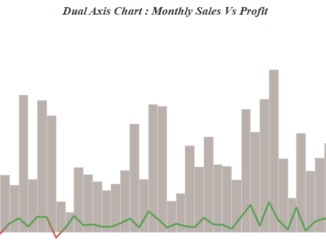
In the previous blog of the series Tableau Charts we discussed about Area Charts. In this blog we will discuss about a very powerful chart type […]
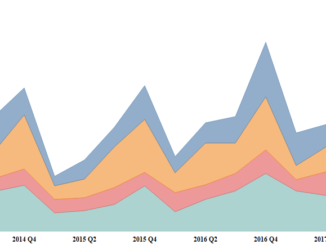
In the previous blog of this series we discussed about Line Charts . Today we will discuss about Area charts. Area charts are constructed in the similar […]
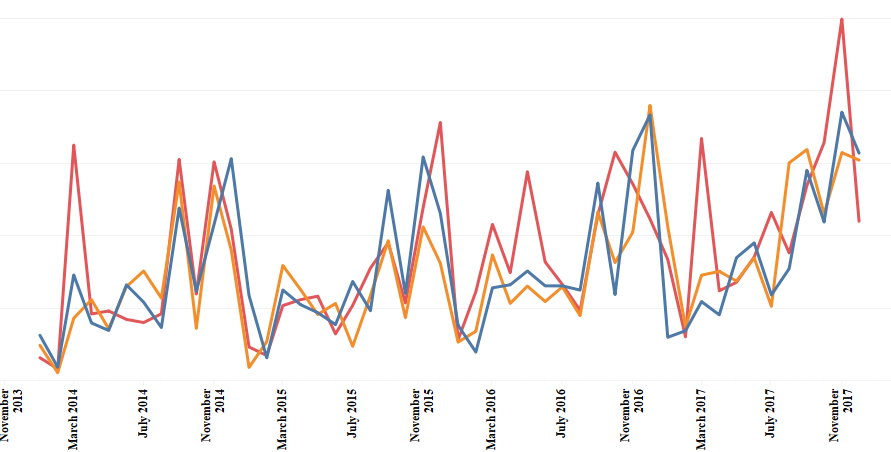
Hi All, In the previous blog of the series Tableau Charts we discussed about Treemaps . Today we will be discussing about one of the most basic […]
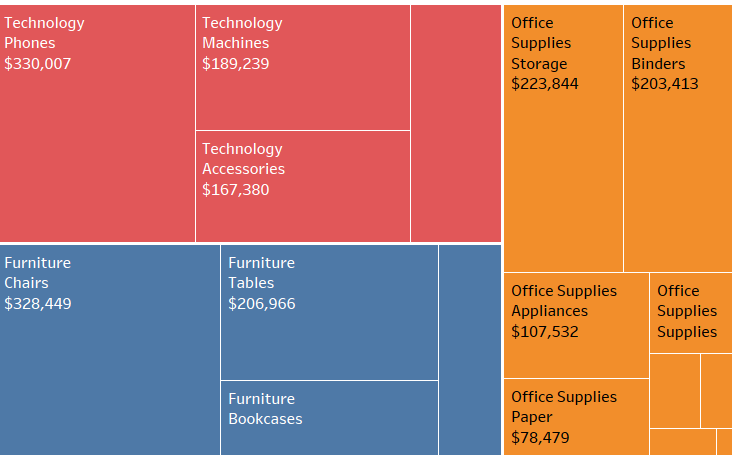
Hi All, In this blog of the ongoing series on Tableau Charts we will talk about Treemaps. A treemap is a diagram representing hierarchical data in […]
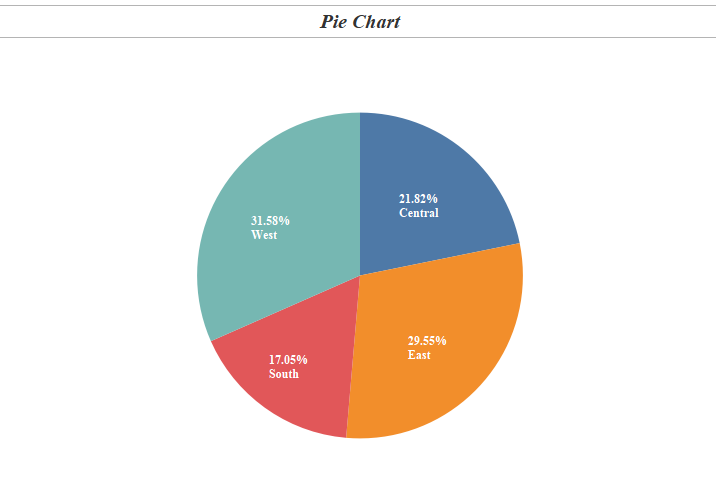
In the last blog in the series Tableau Charts we talked about Symbols & Filled Maps . Today we will talk about a most common chart type […]
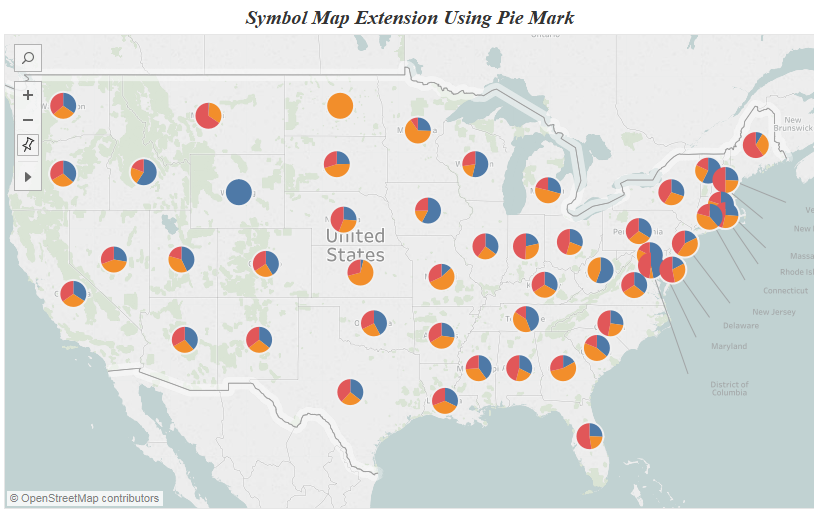
In the previous blog we looked into Heat Maps & Highlight Tables . In tableau when we are dealing with geographic variable we have two options : […]
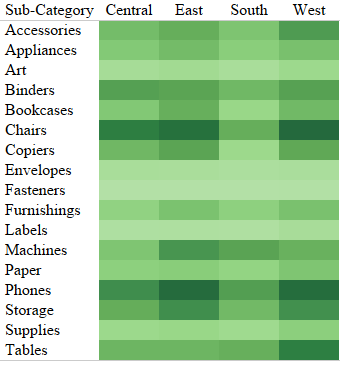
Hi All, In the previous blog in the series Tableau Charts we talked about Text Tables . Today we are going to talk about an extension of […]
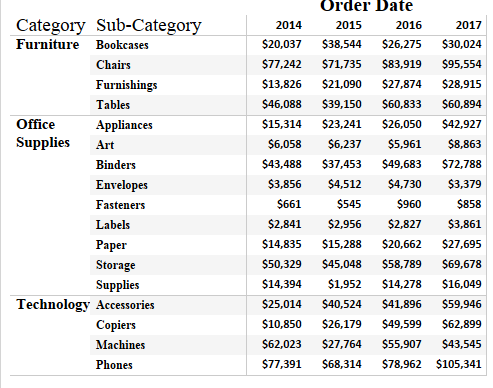
Hi All, In the earlier post in this series we talked about Bar Chart and Variants . In this post and the following we will discuss about […]
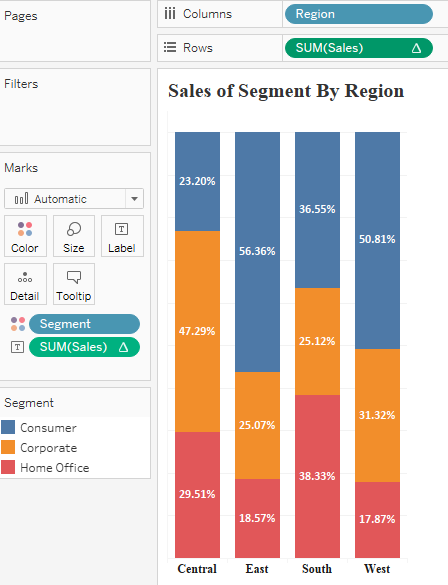
Hello Everyone out there. This is the first in series of my blog post “Visualising data in Tableau from Scratch”. In the subsequent blog following this […]
Copyright © 2025 | WordPress Theme by MH Themes