Advanced Charting: Arrow Charts In tableau
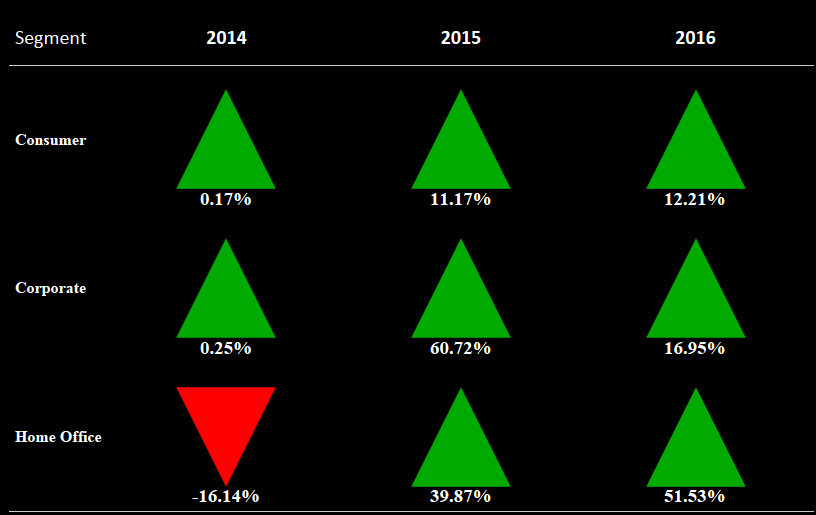
Hi All, In this blog of Advanced charting series I am going to talk about how to build a Up Down arrow chart in tableau. […]
Hi All, In this blog of Advanced charting series I am going to talk about how to build a Up Down arrow chart in tableau. […]
Hi All, In today’s tableau tip we will discuss how to highlight a selected value when selected in the filter dropdown. Let us go ahead […]
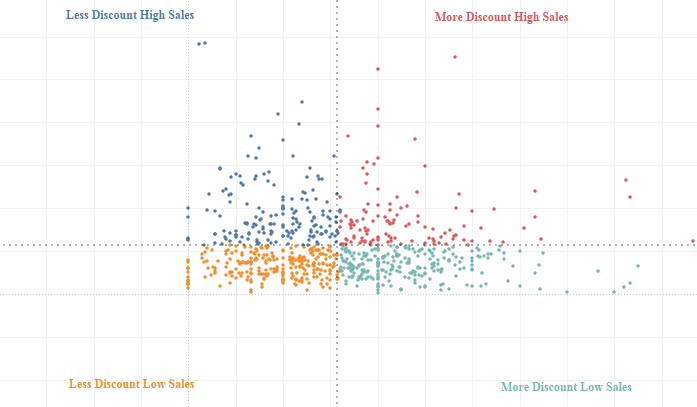
Hi All, In this blog of Advanced charting series we will take a look into how to build a quadrant chart in tableau . A […]
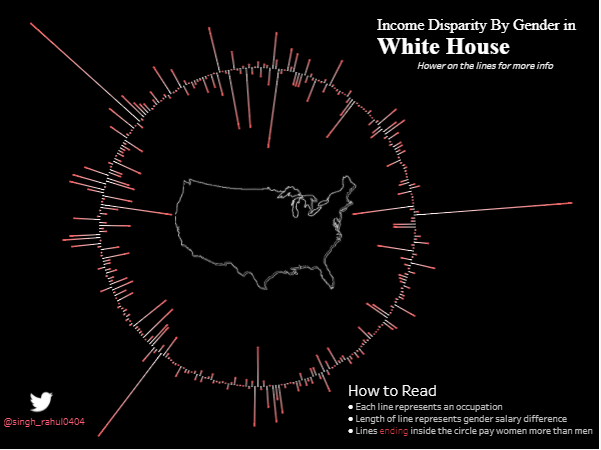
This visualization tells us about the Pay Gap between male and females for the same position in White house. Lines which are inside the circle […]
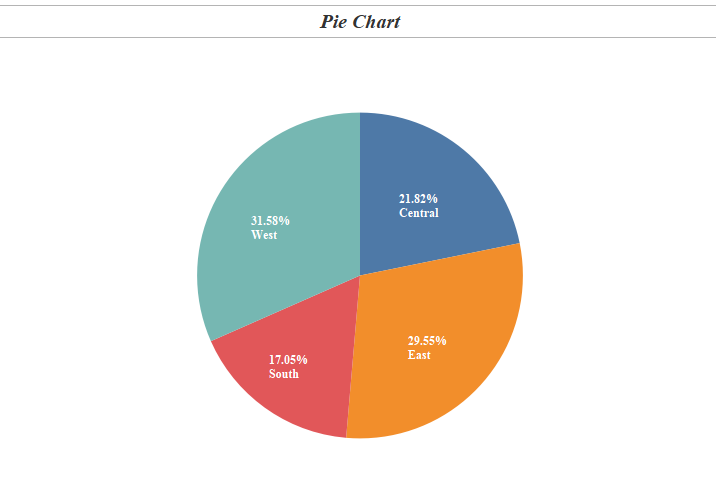
In the last blog in the series Tableau Charts we talked about Symbols & Filled Maps . Today we will talk about a most common chart type […]
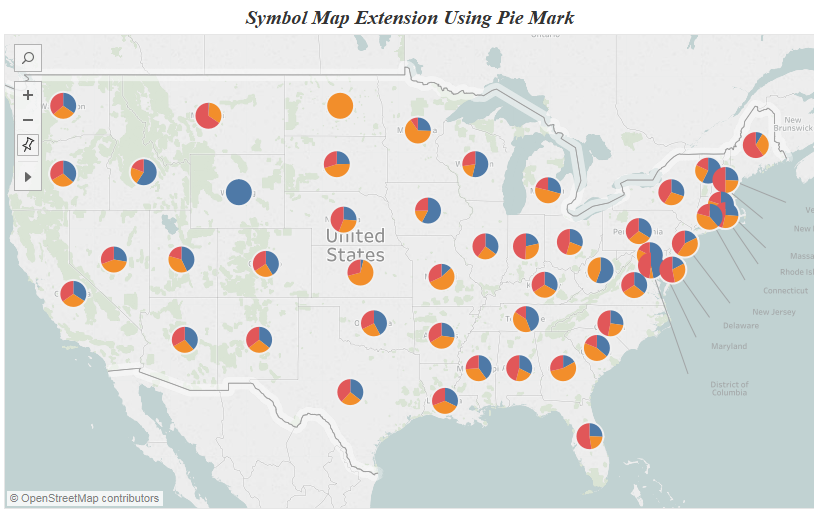
In the previous blog we looked into Heat Maps & Highlight Tables . In tableau when we are dealing with geographic variable we have two options : […]
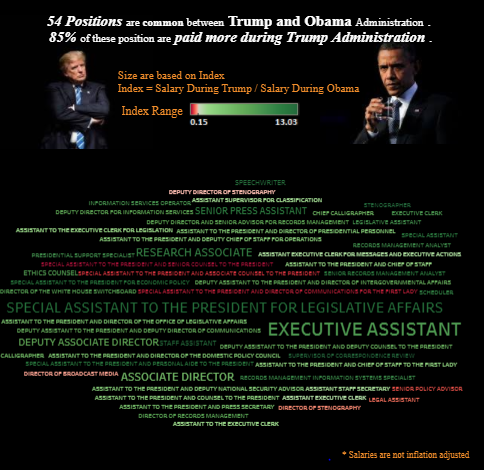
In this blog I tried to visualise how salaries were being paid across different positions under Obama and Trump. The total number of positions under […]
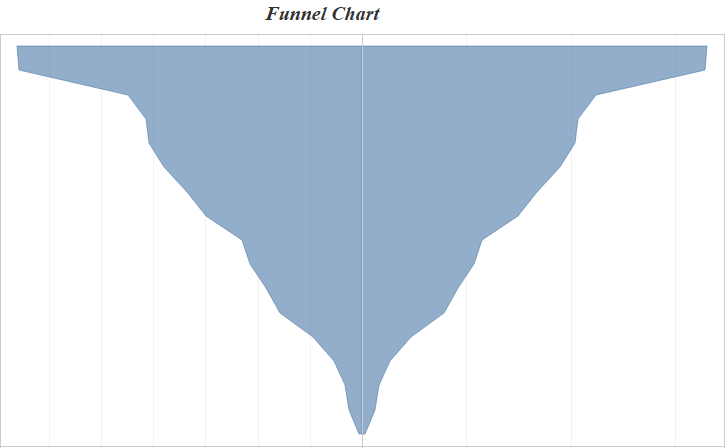
Hi All, In this blog of Advanced Charting using tableau we will see how to build a funnel chart / diverging bar chart in tableau. […]
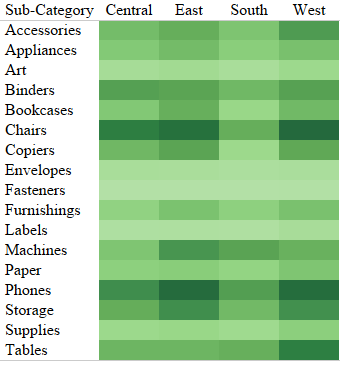
Hi All, In the previous blog in the series Tableau Charts we talked about Text Tables . Today we are going to talk about an extension of […]
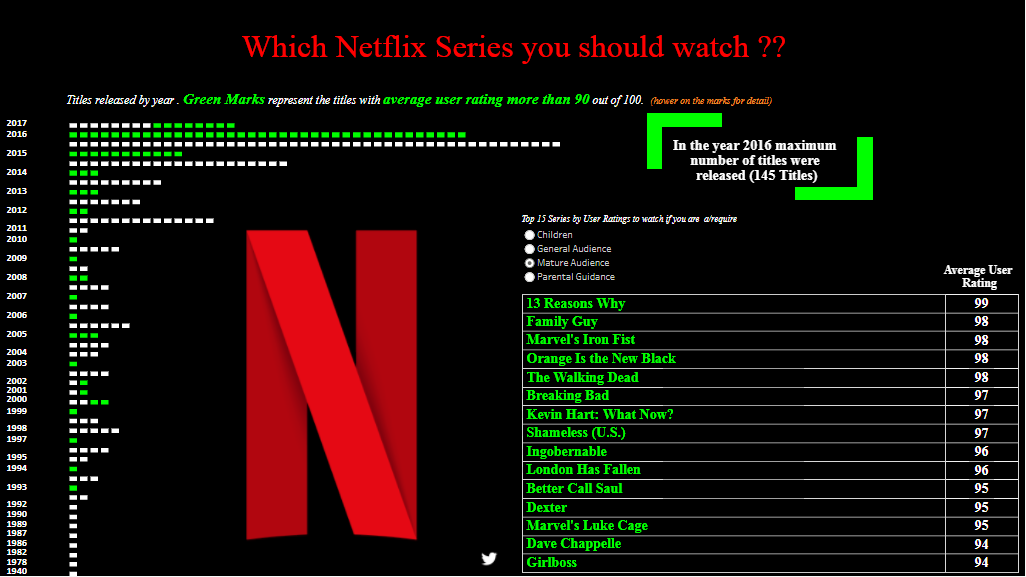
I recently came across a dataset that had the viewers ratings of Netflix shows released by year. I did not go into the dataset to […]
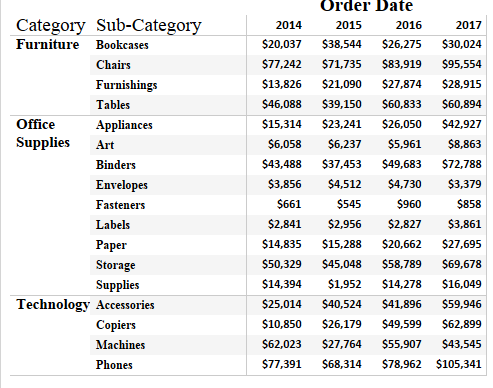
Hi All, In the earlier post in this series we talked about Bar Chart and Variants . In this post and the following we will discuss about […]
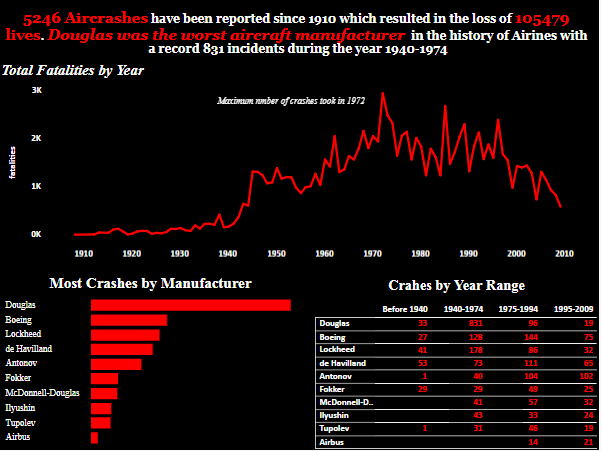
While scavenging for data I came through this dataset which had a list of all the aircraft crashes ( millitary and non millitary ) across […]
Copyright © 2025 | WordPress Theme by MH Themes